Fig. 10
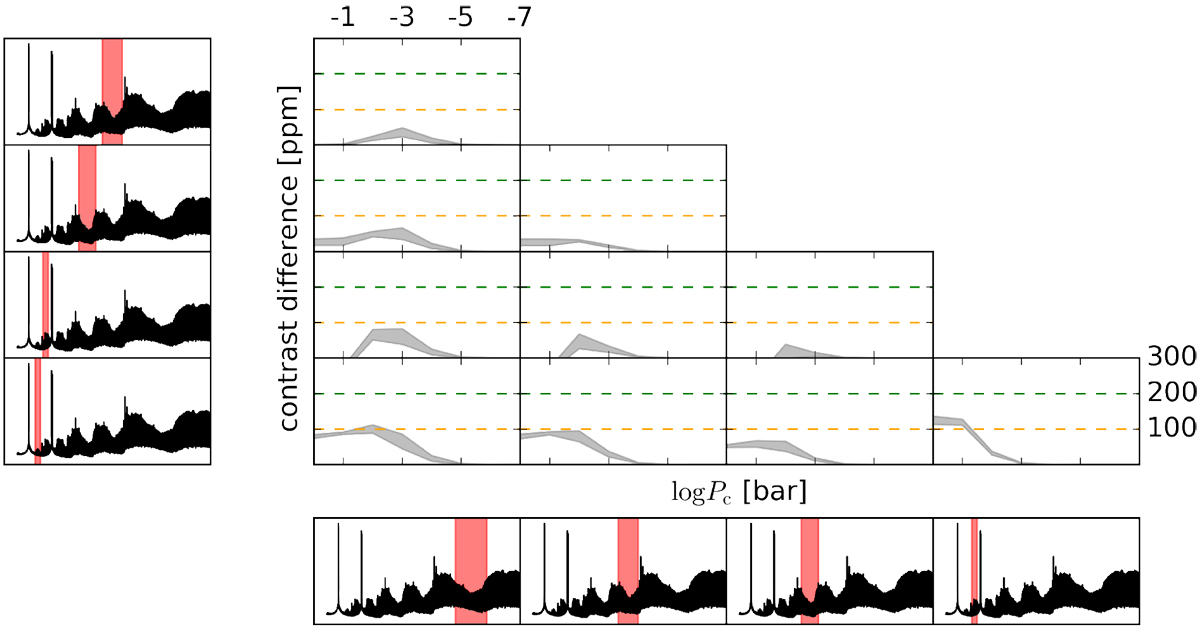
Sensitivity to the presence of aerosols of different combinations of bands that are accessible from the ground even in the presence of tellurics. Each panel shows the difference between the band highlighted in the bottom row and the band highlighted in the left column. The x- and y-axes are the same as for Fig. 7, running between 1 and 10−7 bar and between 0 and 300 ppm, respectively. Orange and green horizontal dashed lines are put in correspondence to the 100 and 200 ppm levels. We note that these values are arbitrary. Scatterers up to the 0.1 mbar level produce values of ΔC up to 100 ppm.
Current usage metrics show cumulative count of Article Views (full-text article views including HTML views, PDF and ePub downloads, according to the available data) and Abstracts Views on Vision4Press platform.
Data correspond to usage on the plateform after 2015. The current usage metrics is available 48-96 hours after online publication and is updated daily on week days.
Initial download of the metrics may take a while.