Fig. 1
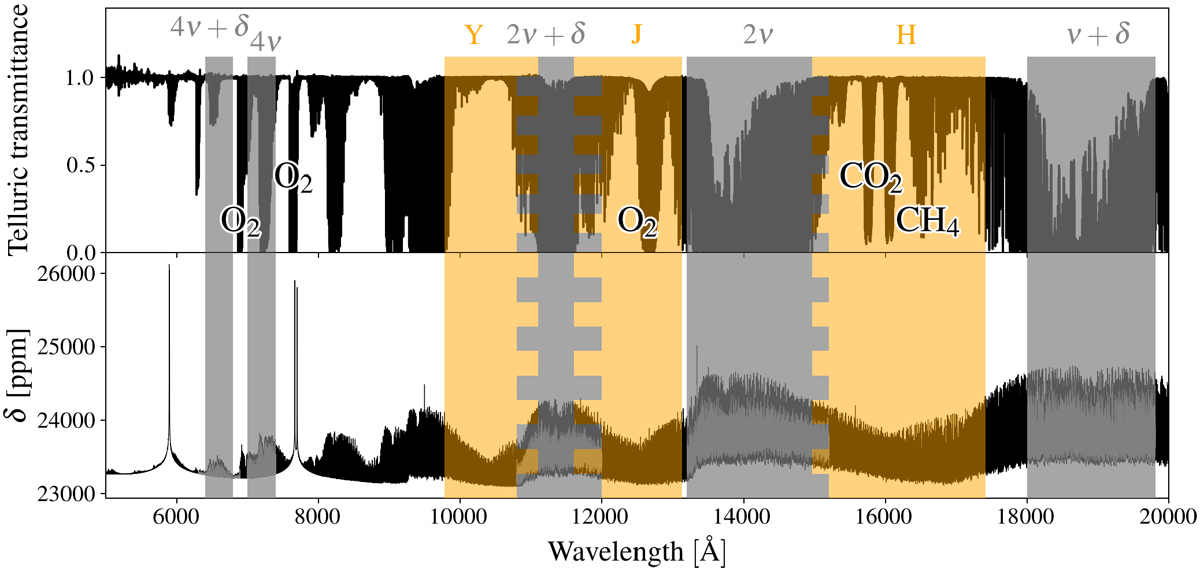
Bands used to compute the CCF of water, on top of the telluric transmittance (upper panel), and an exoplanet transmission spectrum model (lower panel). Grey bands correspond to water vibrational band. Orange bands correspond to the windows of transparency of Earth atmosphere. The bands partially overlap, as indicated by toothed areas. Upper panel: the solid black line represents the transmittance of Earth atmosphere (Hinkle et al. 2003), ranging from 1 (all incident light transmitted) to 0 (all incident light absorbed). Besides water bands, corresponding to the bands in the bottom panel, molecular oxygen, carbon dioxide, and methane show the most prominent features. Lower panel: the solid black line represents a theoretical cloud-free isothermal model of HD189733b. Within each water vibrational band, the region of the spectrum in grey represents the spectrum seen through a selected instrument, thus convolved at the appropriate resolving power (see Table 1).
Current usage metrics show cumulative count of Article Views (full-text article views including HTML views, PDF and ePub downloads, according to the available data) and Abstracts Views on Vision4Press platform.
Data correspond to usage on the plateform after 2015. The current usage metrics is available 48-96 hours after online publication and is updated daily on week days.
Initial download of the metrics may take a while.