Fig. 6.
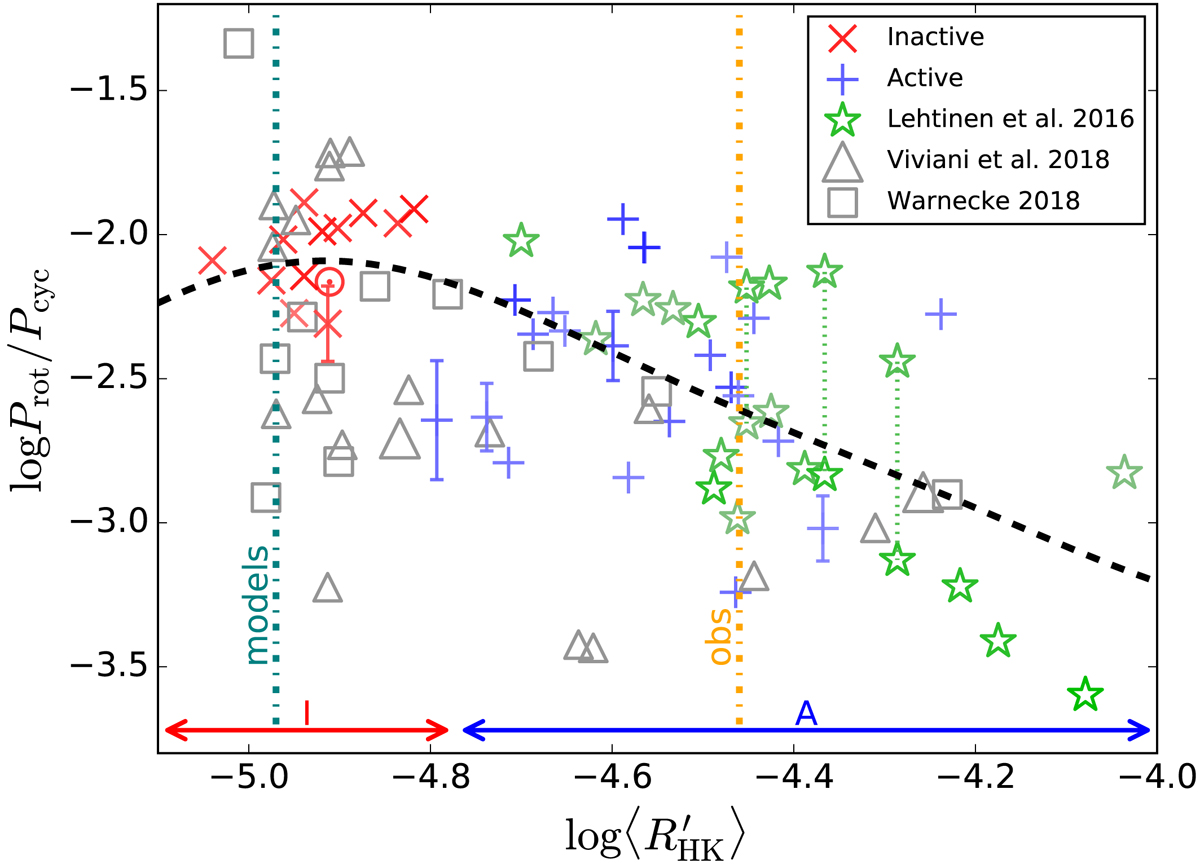
Comparison of the results of quasi-periodic GP model and different other observational and modelling studies. Green stars are taken from the analysis of long-term photometry of solar-type stars (Lehtinen et al. 2016), where intensity reflects the cycle grade. Grey squares are from the wedge study of turbulent magnetoconvetion by Warnecke (2018), while grey triangles are from a corresponding study of Viviani et al. (2018), where the wedge assumption was relaxed in the azimuthal direction, allowing for nonaxisymmetric solutions. Larger triangles indicate high-resolution runs. In the bottom of the figure we have shown the ranges of the inactive, active and transitional branches using arrows. The vertical dash-dotted lines mark the points where axi- to nonaxisymmetrical transition occurs accordingly to models and observations. The dashed black curve represents a blend of two linear fits to the inactive and active plus transitional branch. The remaining colour and symbol codings are identical to the one in Fig. 4. Here we have used the magnetic to kinetic energy ratio obtained in the models as a proxy for calculating the ![]() activity measure. The runs with solar rotation rates have been fixed to the solar
activity measure. The runs with solar rotation rates have been fixed to the solar ![]() value, and to scale the axis we have used the relation
value, and to scale the axis we have used the relation ![]() . Two of the simulations from Viviani et al. (2018) with highest magnetic activity levels, being incomparable with observational data, have been omitted from the plot.
. Two of the simulations from Viviani et al. (2018) with highest magnetic activity levels, being incomparable with observational data, have been omitted from the plot.
Current usage metrics show cumulative count of Article Views (full-text article views including HTML views, PDF and ePub downloads, according to the available data) and Abstracts Views on Vision4Press platform.
Data correspond to usage on the plateform after 2015. The current usage metrics is available 48-96 hours after online publication and is updated daily on week days.
Initial download of the metrics may take a while.