Fig. 3.
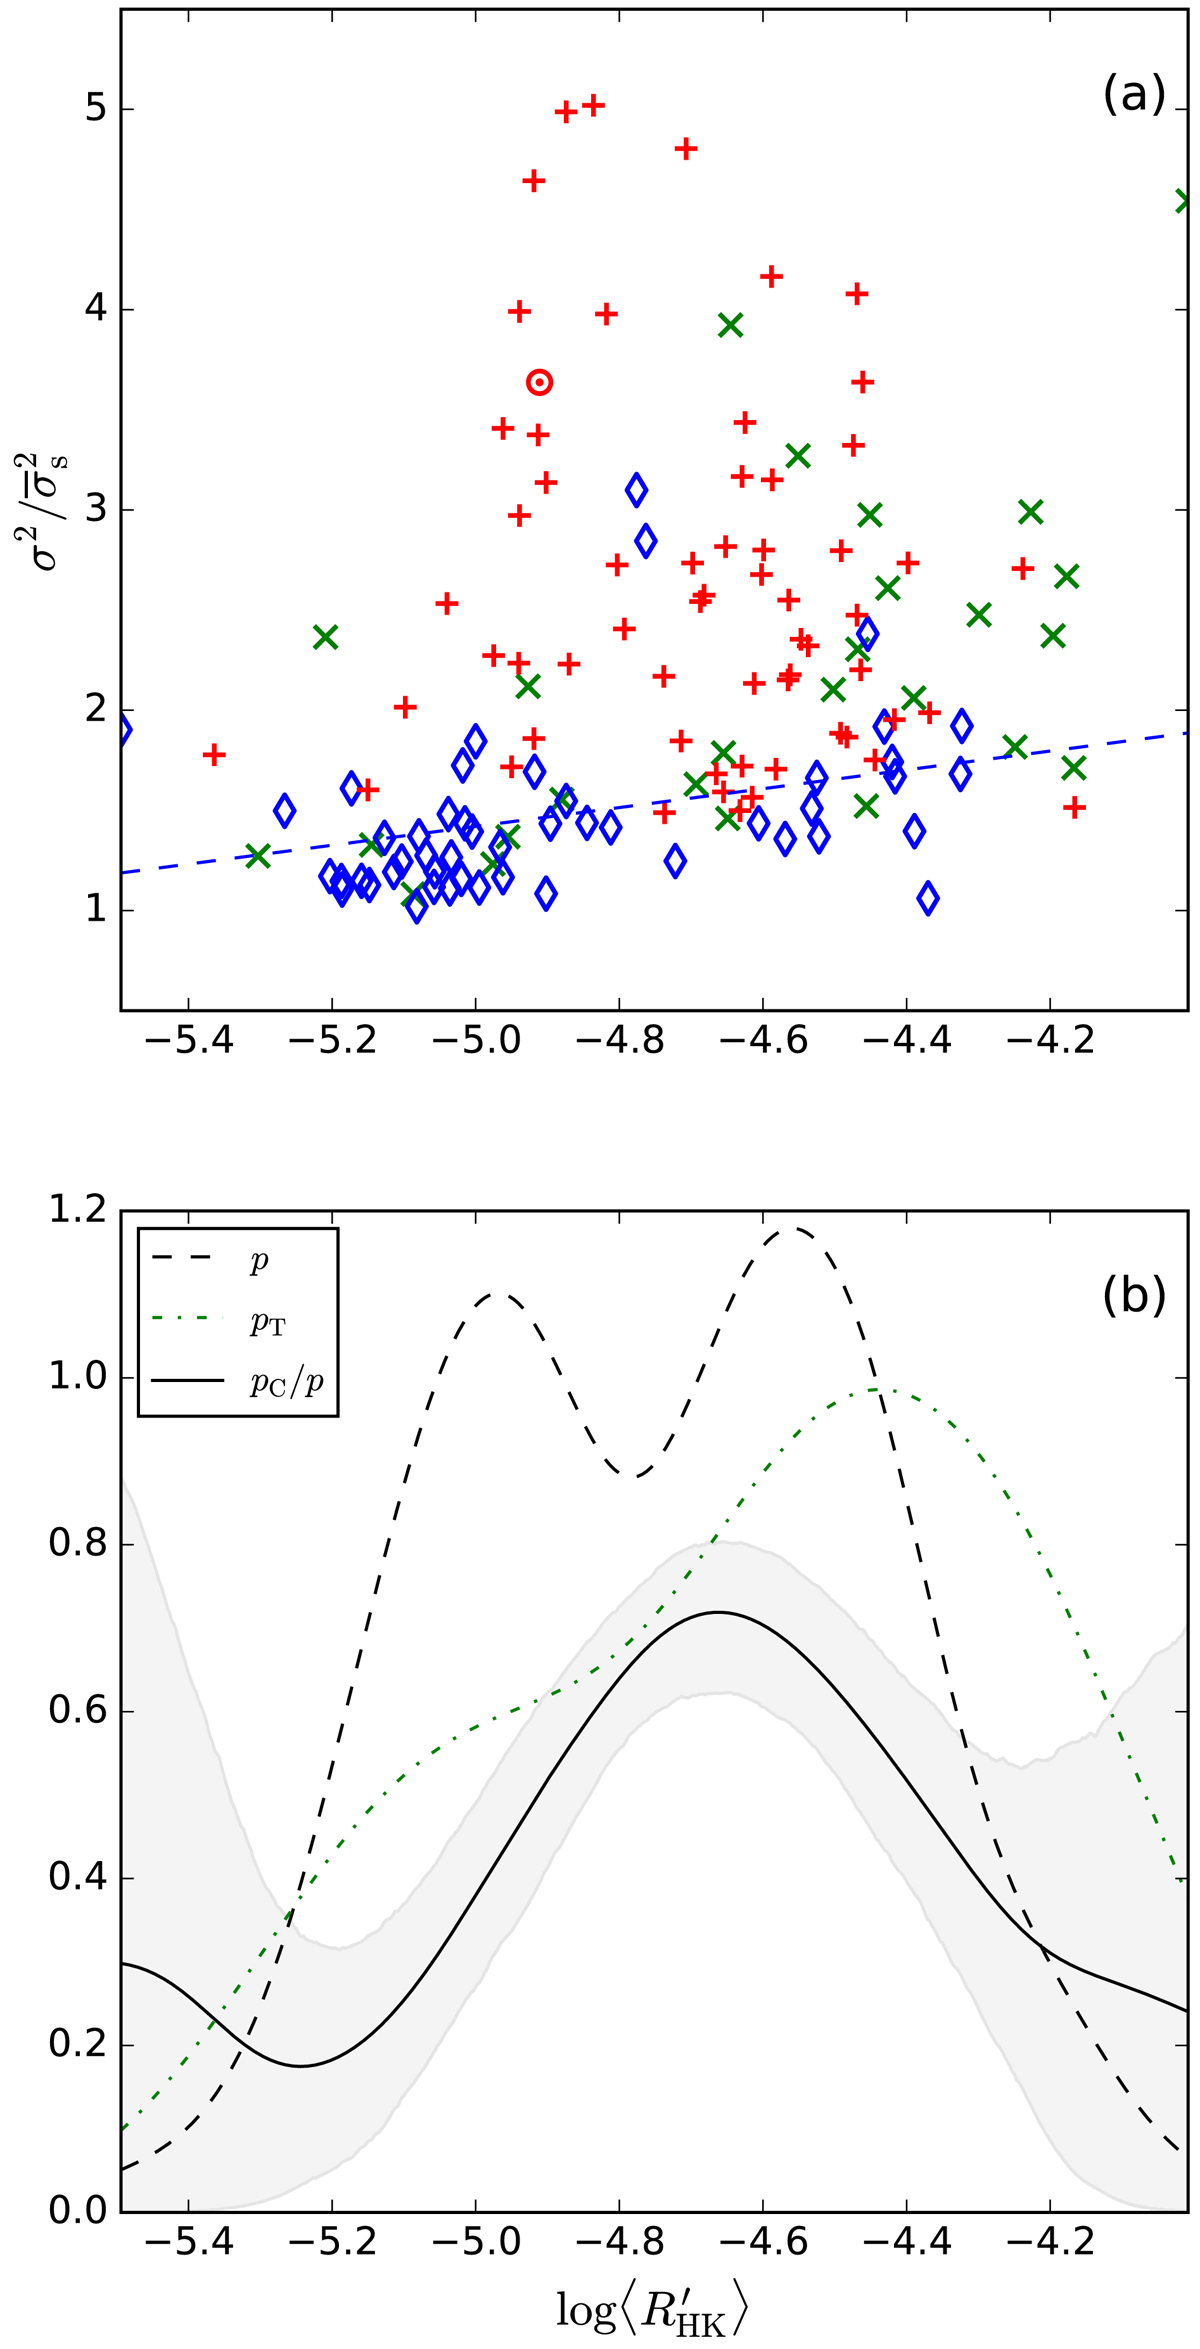
Panel a: ratio of total variance to average seasonal variance vs. log ![]() . NC stars (blue diamonds), T stars (green crosses), C stars (red pluses). Blue dashed line represents the linear fit to the data of NC stars. Panel b: p is the density (i.e. number of stars per unit log
. NC stars (blue diamonds), T stars (green crosses), C stars (red pluses). Blue dashed line represents the linear fit to the data of NC stars. Panel b: p is the density (i.e. number of stars per unit log ![]() ) of all stars, pC is the density of the stars with cycles and pT is the density of the stars having a linear trend. The solid black curve represents the percentage of C stars as function of log
) of all stars, pC is the density of the stars with cycles and pT is the density of the stars having a linear trend. The solid black curve represents the percentage of C stars as function of log ![]() .
.
Current usage metrics show cumulative count of Article Views (full-text article views including HTML views, PDF and ePub downloads, according to the available data) and Abstracts Views on Vision4Press platform.
Data correspond to usage on the plateform after 2015. The current usage metrics is available 48-96 hours after online publication and is updated daily on week days.
Initial download of the metrics may take a while.