Free Access
Fig. 2.
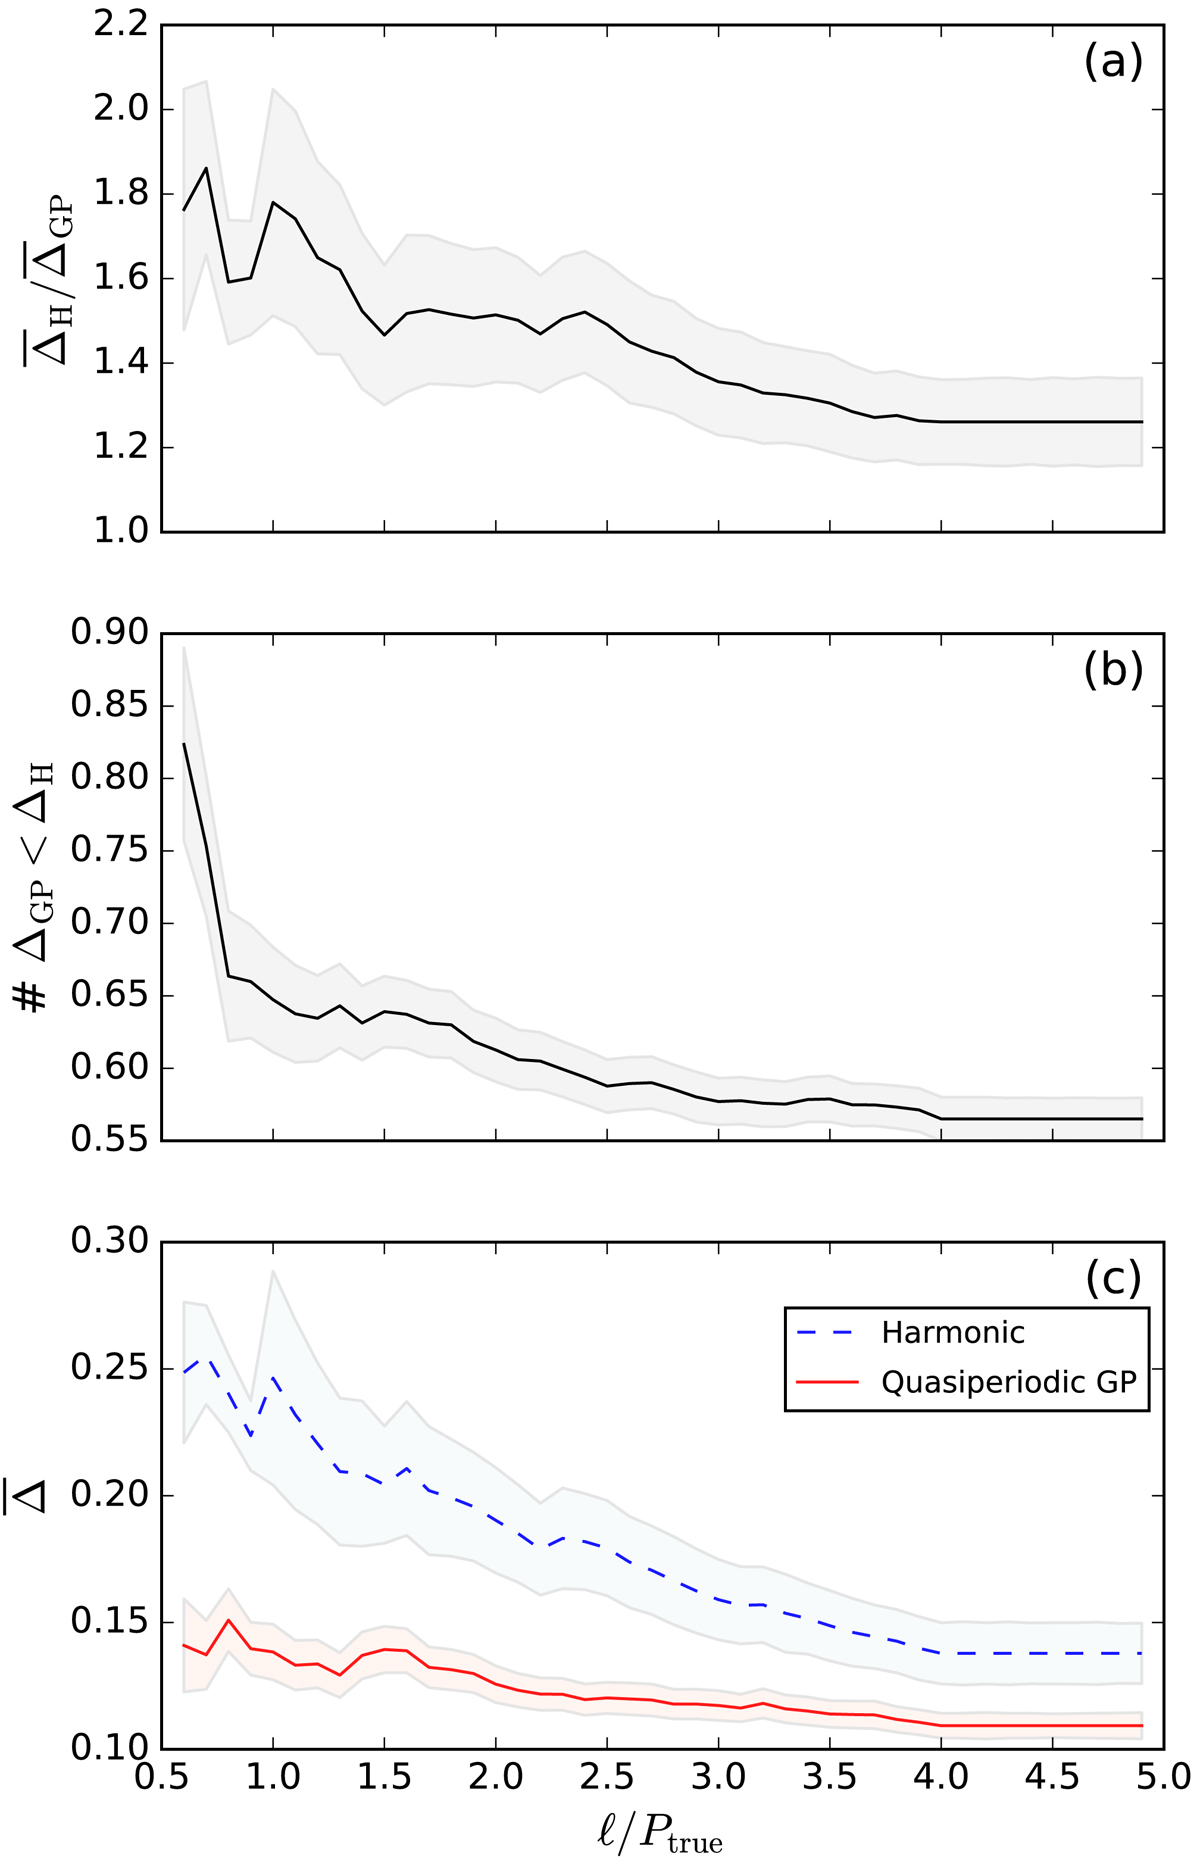
Diagnostics of the experiments comparing QP and H models. Panel a: ratio of average relative errors, panel b: fraction of experiments where GP outperformed harmonic model, panel c: relative errors of QP (red continuous curve) and H (blue dashed curve) models.
Current usage metrics show cumulative count of Article Views (full-text article views including HTML views, PDF and ePub downloads, according to the available data) and Abstracts Views on Vision4Press platform.
Data correspond to usage on the plateform after 2015. The current usage metrics is available 48-96 hours after online publication and is updated daily on week days.
Initial download of the metrics may take a while.