Fig. 1.
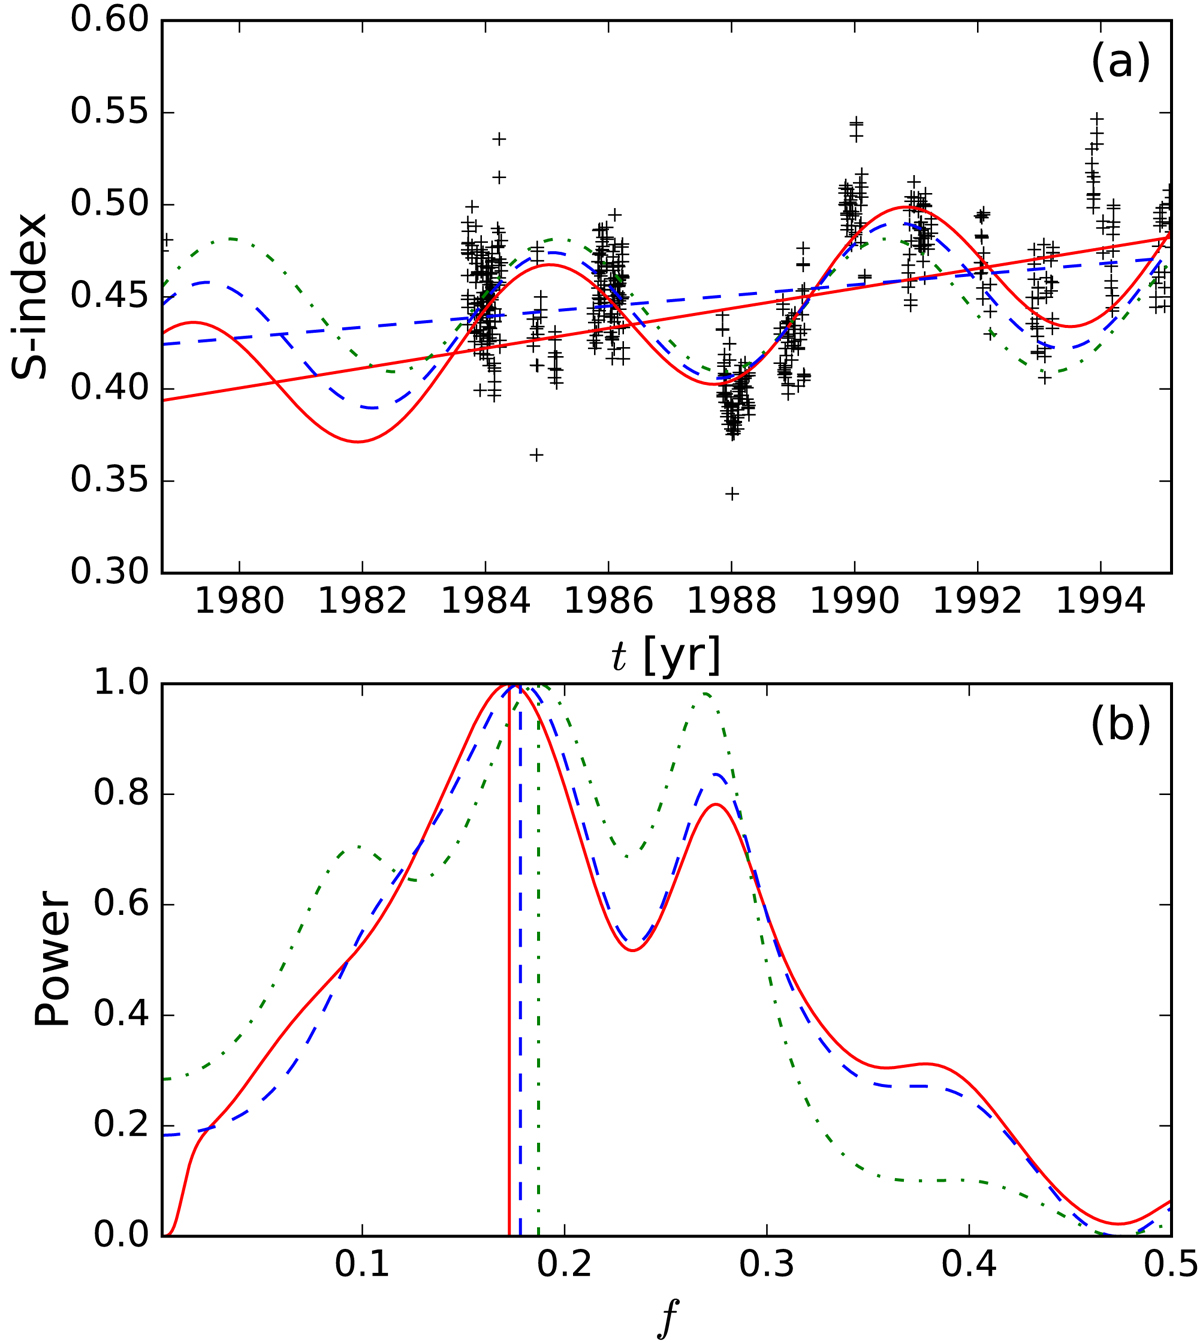
Comparison of the results for the star HD 37394 using BGLST model and GLS models with and without detrending. Panel a: data (black crosses), BGLST model (red continuous curve), GLS model fitted to detrended data with trend added back (blue dashed curve), GLS model fitted to the original data (green dash-dotted curve), trend component of the BGLST model (red line) and empirical trend (blue dashed line). Panel b: spectra of the models with the same colours. Vertical lines mark the locations of the corresponding maxima.
Current usage metrics show cumulative count of Article Views (full-text article views including HTML views, PDF and ePub downloads, according to the available data) and Abstracts Views on Vision4Press platform.
Data correspond to usage on the plateform after 2015. The current usage metrics is available 48-96 hours after online publication and is updated daily on week days.
Initial download of the metrics may take a while.