Fig. 6
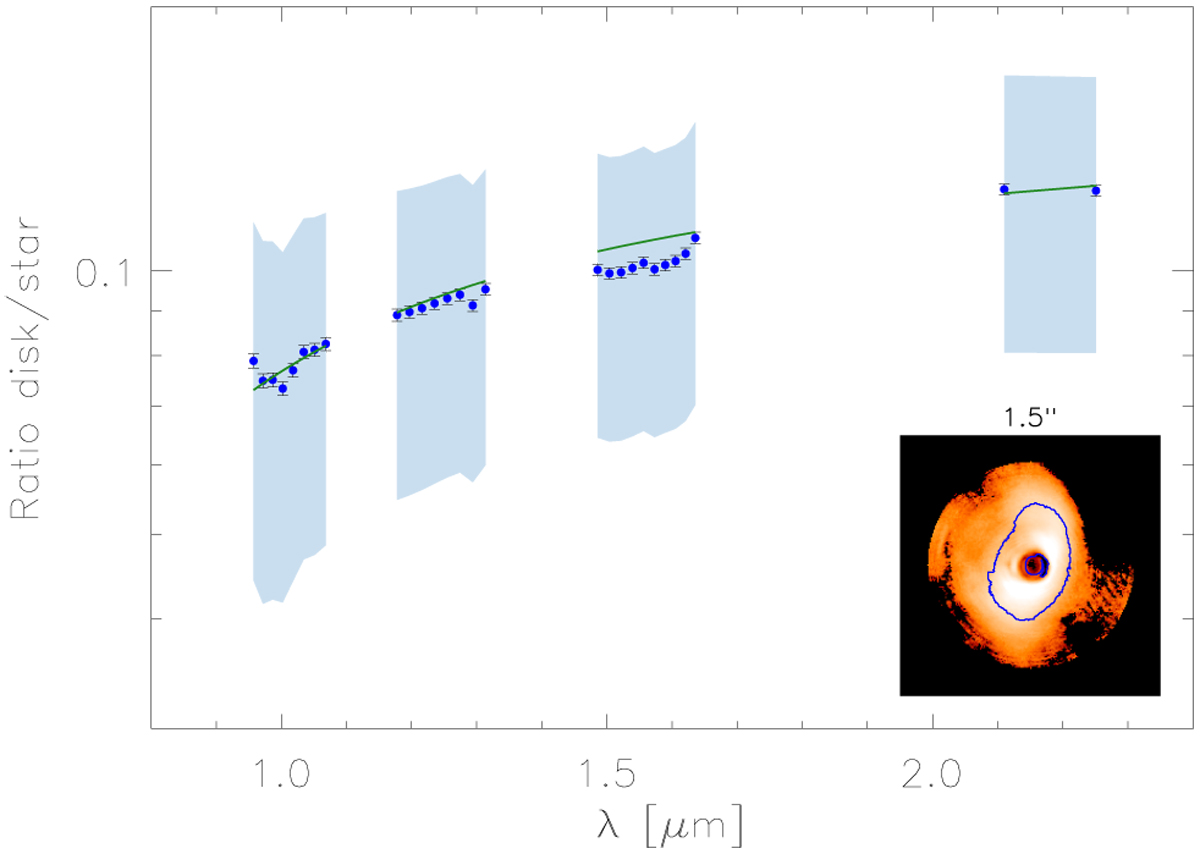
Disk mean spectrum of HD 100546 along the wings. The blue dots and the shaded regions refer to the median value and its 3σ uncertainty. The green line represent the best fit obtained with light reflected by dust with constant albedo A = 0.65. In the bottom-right inset panel, the area selected for the spectrum extraction on the RDI images is delimited in blue.
Current usage metrics show cumulative count of Article Views (full-text article views including HTML views, PDF and ePub downloads, according to the available data) and Abstracts Views on Vision4Press platform.
Data correspond to usage on the plateform after 2015. The current usage metrics is available 48-96 hours after online publication and is updated daily on week days.
Initial download of the metrics may take a while.