Fig. 4
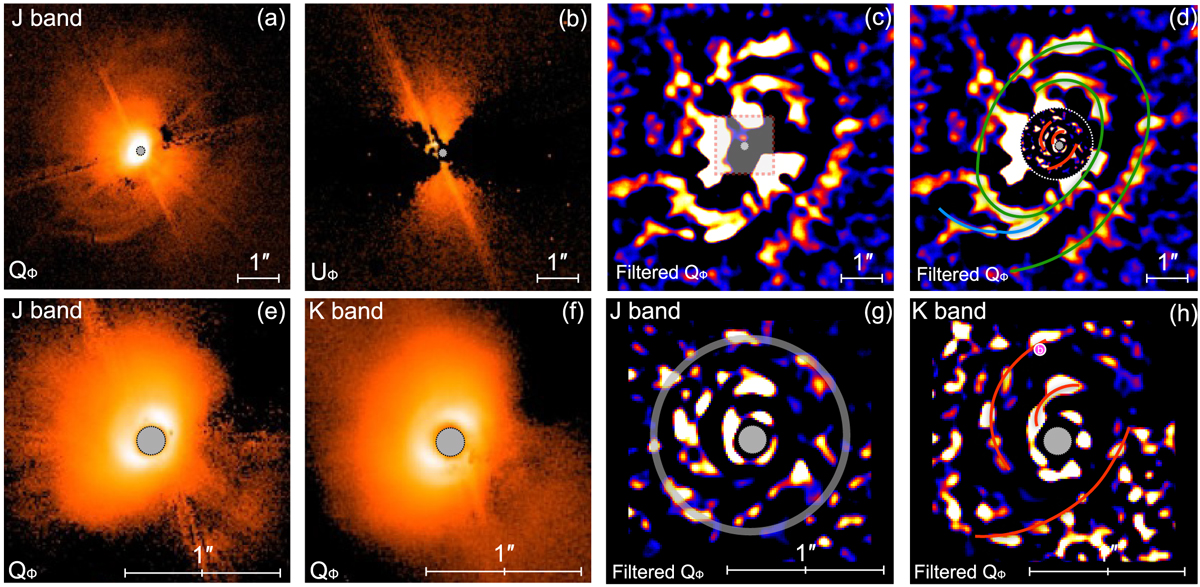
Polarised light images of HD100546 from SPHERE/IRDIS. Panel a: the Qϕ image in the J band. Panel b: the Uϕ image in the J band. Panel c: unsharp masking of the Qϕ image in the J band (see text). The inner box defines the region displayed in the bottom row. Panel d: labelled version of panel c. The inner inset circle is from panel g. Panel e: inner detail of the Qϕ image in the J band. Panel f: inner detail of the Qϕ image in the K band. Panel g: unsharp masking (see text) of panel e. The grey circle indicates the IRDIS control radius at r ≈ 20 × λ∕D (see text). Panel h: unsharp masking (see text) of panel f. Features visible from both panels g and h are labelled. The purple dot indicates the location of CCb from Quanz et al. (2013). In all images, the central star is in the middle of the grey circle, symbolizing the instrument coronagraphic mask. The logarithmic colour stretch is relatively arbitrary and refers to positive values, except in panels a and b where it is the same. North is up, east is left.
Current usage metrics show cumulative count of Article Views (full-text article views including HTML views, PDF and ePub downloads, according to the available data) and Abstracts Views on Vision4Press platform.
Data correspond to usage on the plateform after 2015. The current usage metrics is available 48-96 hours after online publication and is updated daily on week days.
Initial download of the metrics may take a while.