Fig. 13
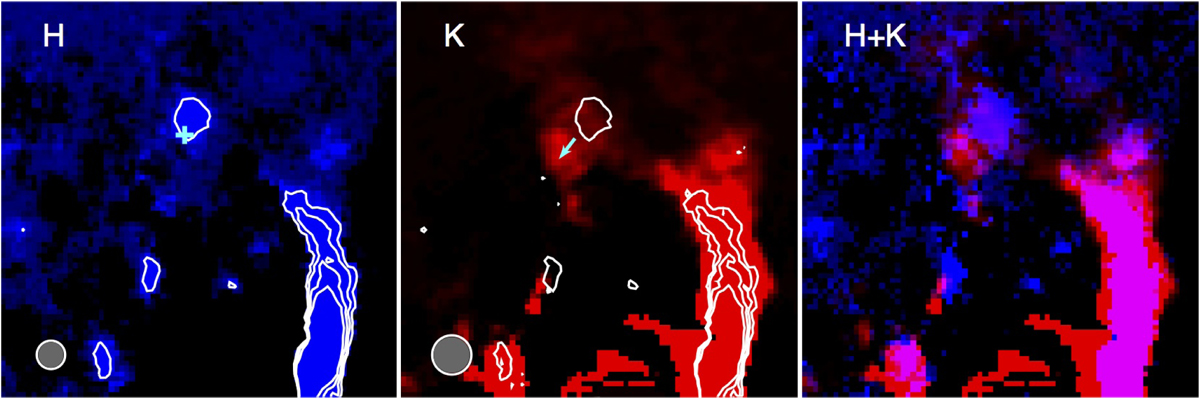
Comparison of HD 100546 images in different band filters. One-component PCA images of IRDIS H2H3 taken on May 29, 2015 (left panel), K1K2 taken on May 3, 2015 (middle panel), and their combination (right panel). Contours refer to IRDIS H2H3. The cross represents Currie et al. (2015) detection in GPI H band, the arrow in the central panel indicates the motion of CCb between the Quanz et al. (2015) detection in NACO L′ band and our May 2016 K1K2 detection of CCb. The grey circle represents the resolution element of the images.
Current usage metrics show cumulative count of Article Views (full-text article views including HTML views, PDF and ePub downloads, according to the available data) and Abstracts Views on Vision4Press platform.
Data correspond to usage on the plateform after 2015. The current usage metrics is available 48-96 hours after online publication and is updated daily on week days.
Initial download of the metrics may take a while.