Fig. 10
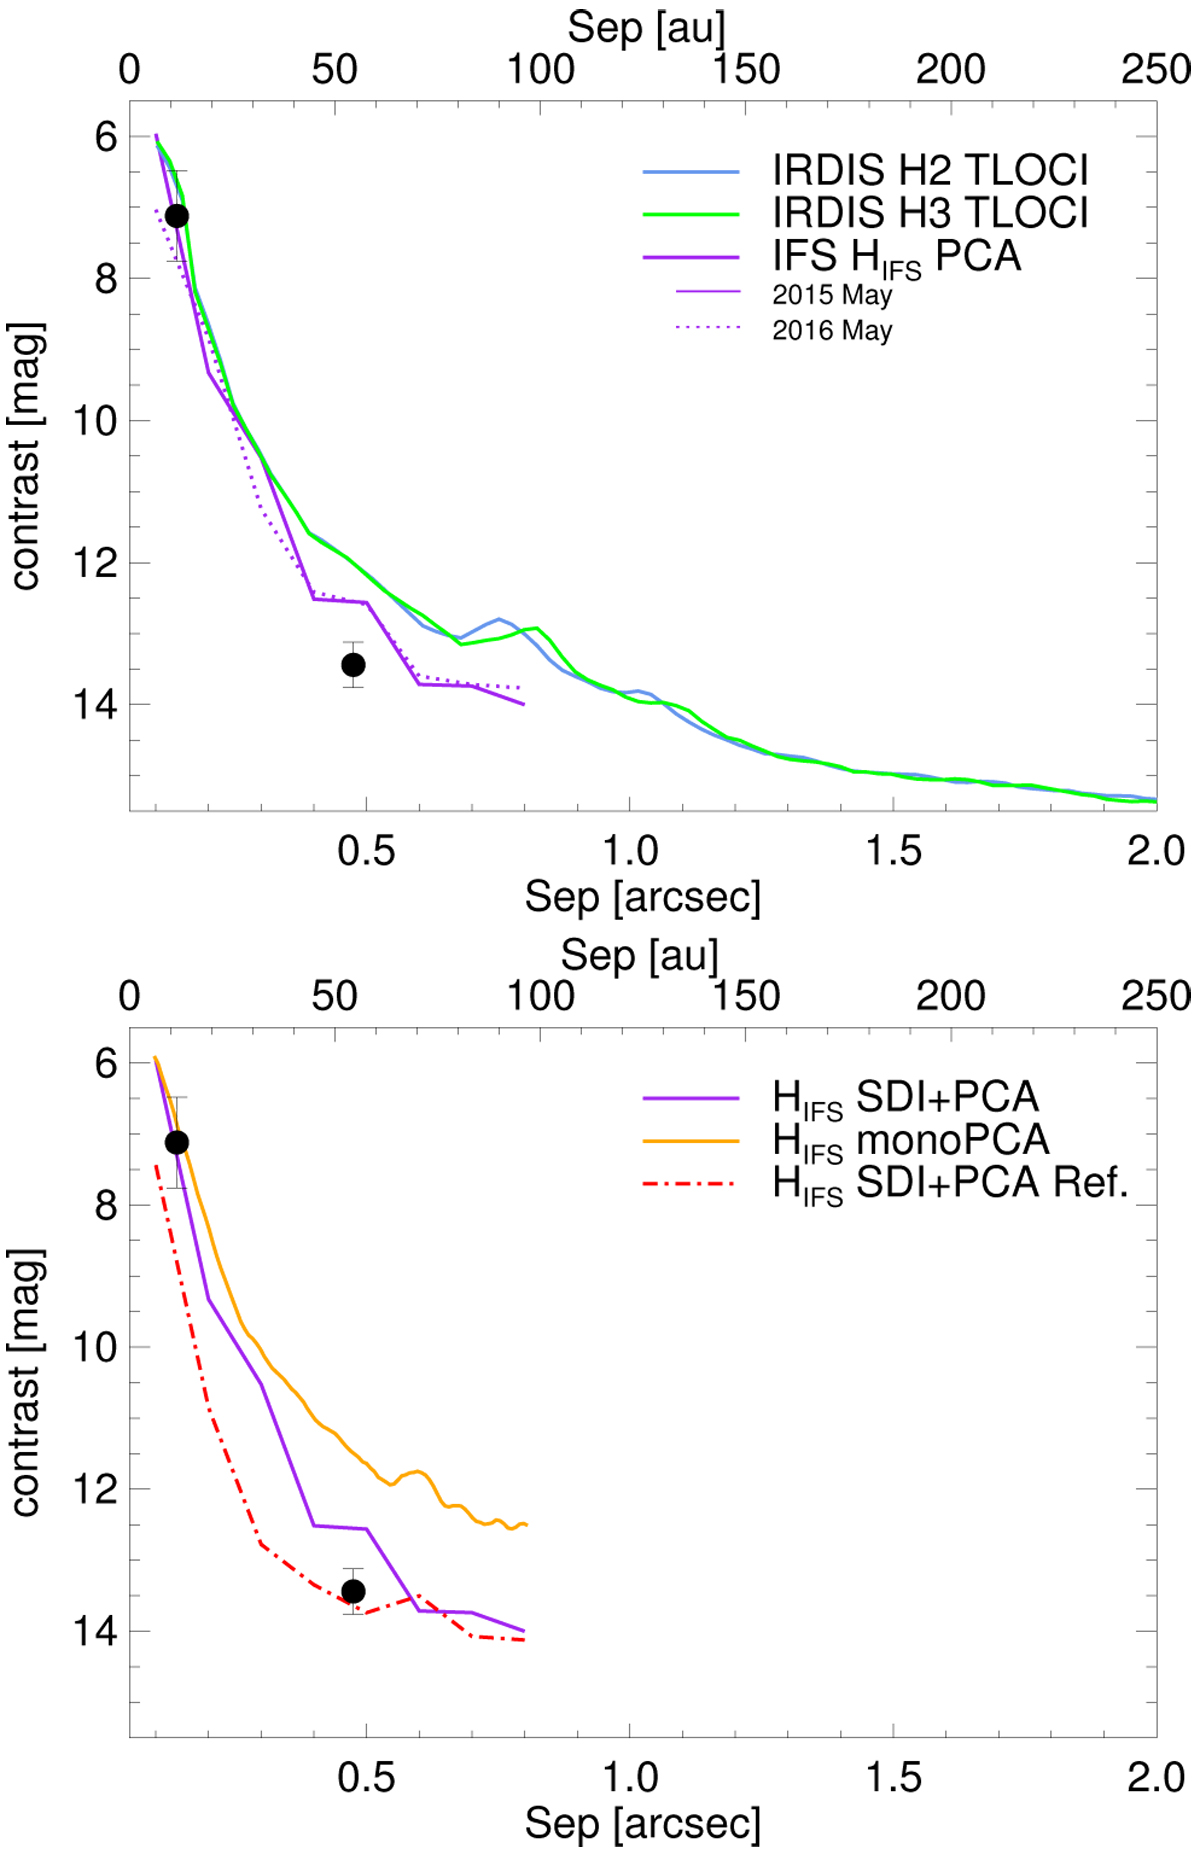
Top panel: contrast curves for HD 100546 obtained in the HIFS band for the two best IFS datasets applying SDI+PCA and for IRDIS H2H3 dataset applying TLOCI. Bottom panel: The IFS May 2015 contrast curve shown above is compared with the result obtained with a two-mode monochromatic PCA (orange curve) and with the contrast curve in the HIFS band for HD 95086 applying SDI+PCA (in red dashed-dotted line). The planets contrast values measured in the H band obtained by Currie et al. (2015) with GPI are reported in both panels.
Current usage metrics show cumulative count of Article Views (full-text article views including HTML views, PDF and ePub downloads, according to the available data) and Abstracts Views on Vision4Press platform.
Data correspond to usage on the plateform after 2015. The current usage metrics is available 48-96 hours after online publication and is updated daily on week days.
Initial download of the metrics may take a while.