Free Access
Fig. 4
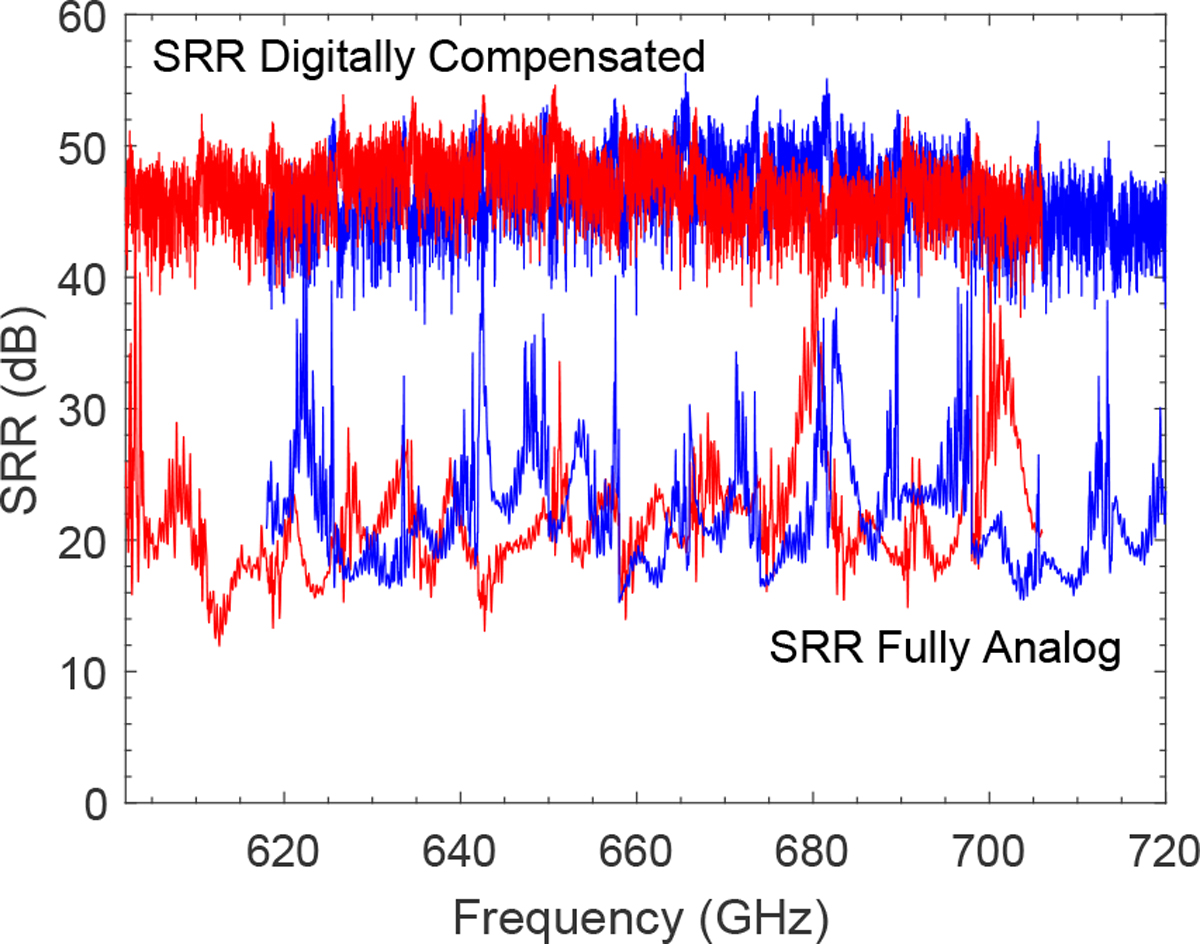
SRR of the 2SB receiver measured with and without digital compensation. We point out that the digitally compensated SRR has been taken at a much denser frequency grid. Red and blue traces correspond to the LSB and USB frequencies, respectively.
Current usage metrics show cumulative count of Article Views (full-text article views including HTML views, PDF and ePub downloads, according to the available data) and Abstracts Views on Vision4Press platform.
Data correspond to usage on the plateform after 2015. The current usage metrics is available 48-96 hours after online publication and is updated daily on week days.
Initial download of the metrics may take a while.