Fig. 7.
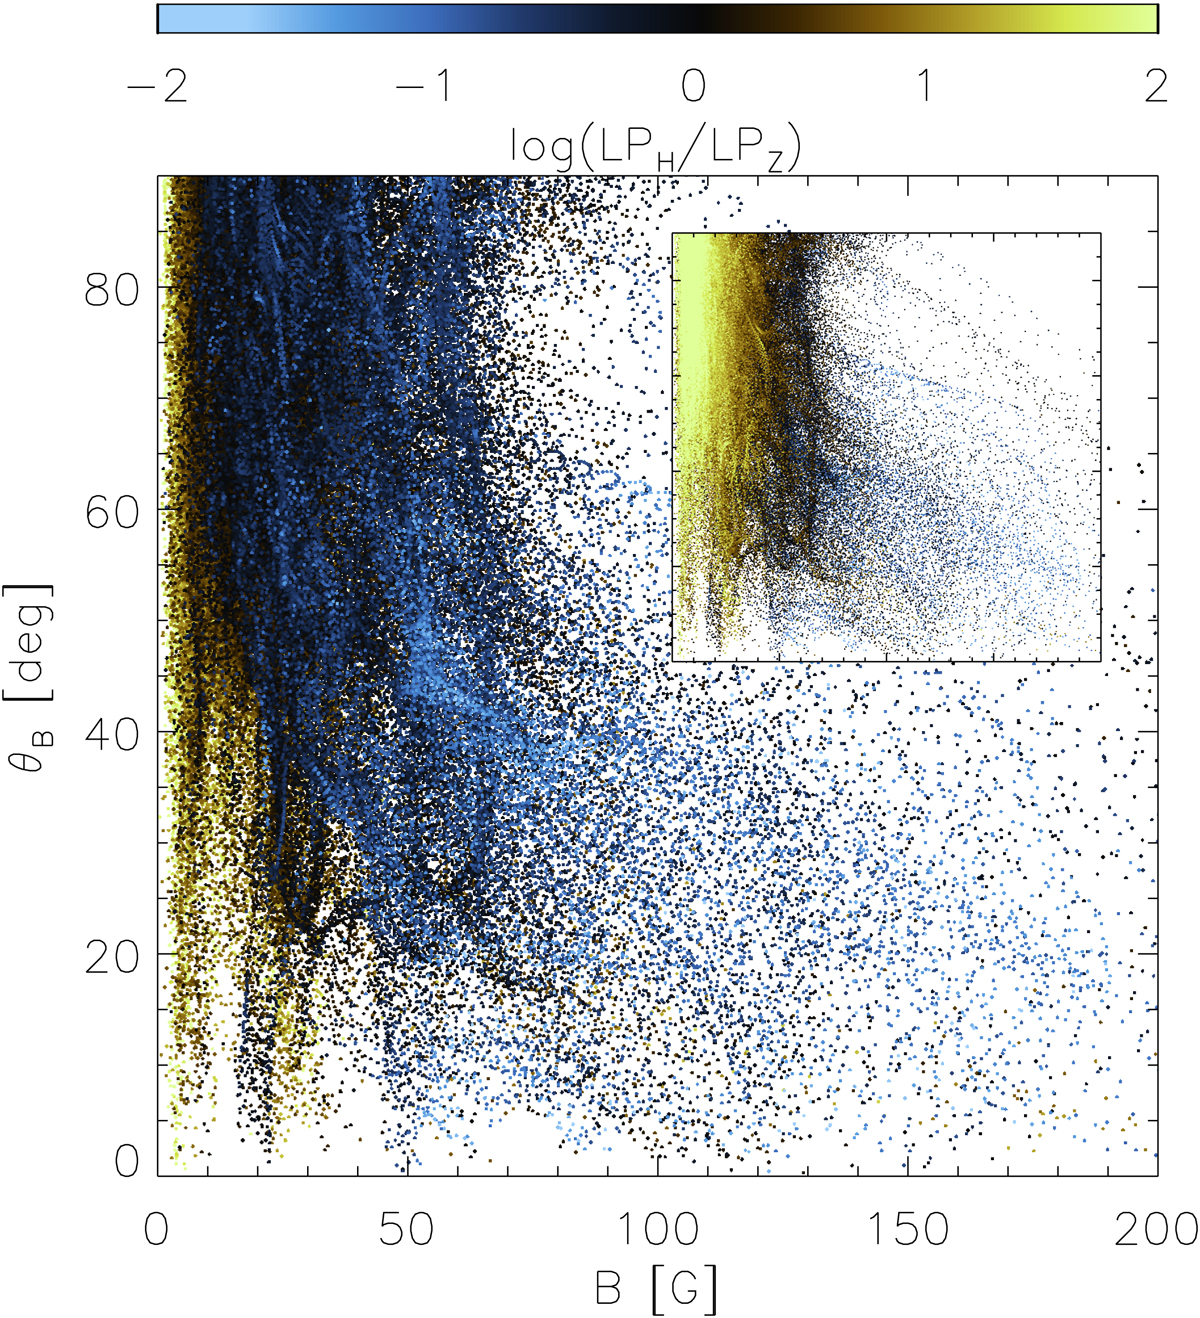
Scatter plot of the ratio of the maximum linear polarisation signal produced by scattering polarisation and the Hanle effect (LPH) and the Zeeman effect (LPZ) as a function of the magnetic field strength and inclination. In the main plot, the preference is given to points with lower (less common) values of LPH/LPZ. In the inset, the preference is given to the pixels with higher values of LPH/LPZ. The scale of the inset axes is identical to the main plot.
Current usage metrics show cumulative count of Article Views (full-text article views including HTML views, PDF and ePub downloads, according to the available data) and Abstracts Views on Vision4Press platform.
Data correspond to usage on the plateform after 2015. The current usage metrics is available 48-96 hours after online publication and is updated daily on week days.
Initial download of the metrics may take a while.