Fig. 5.
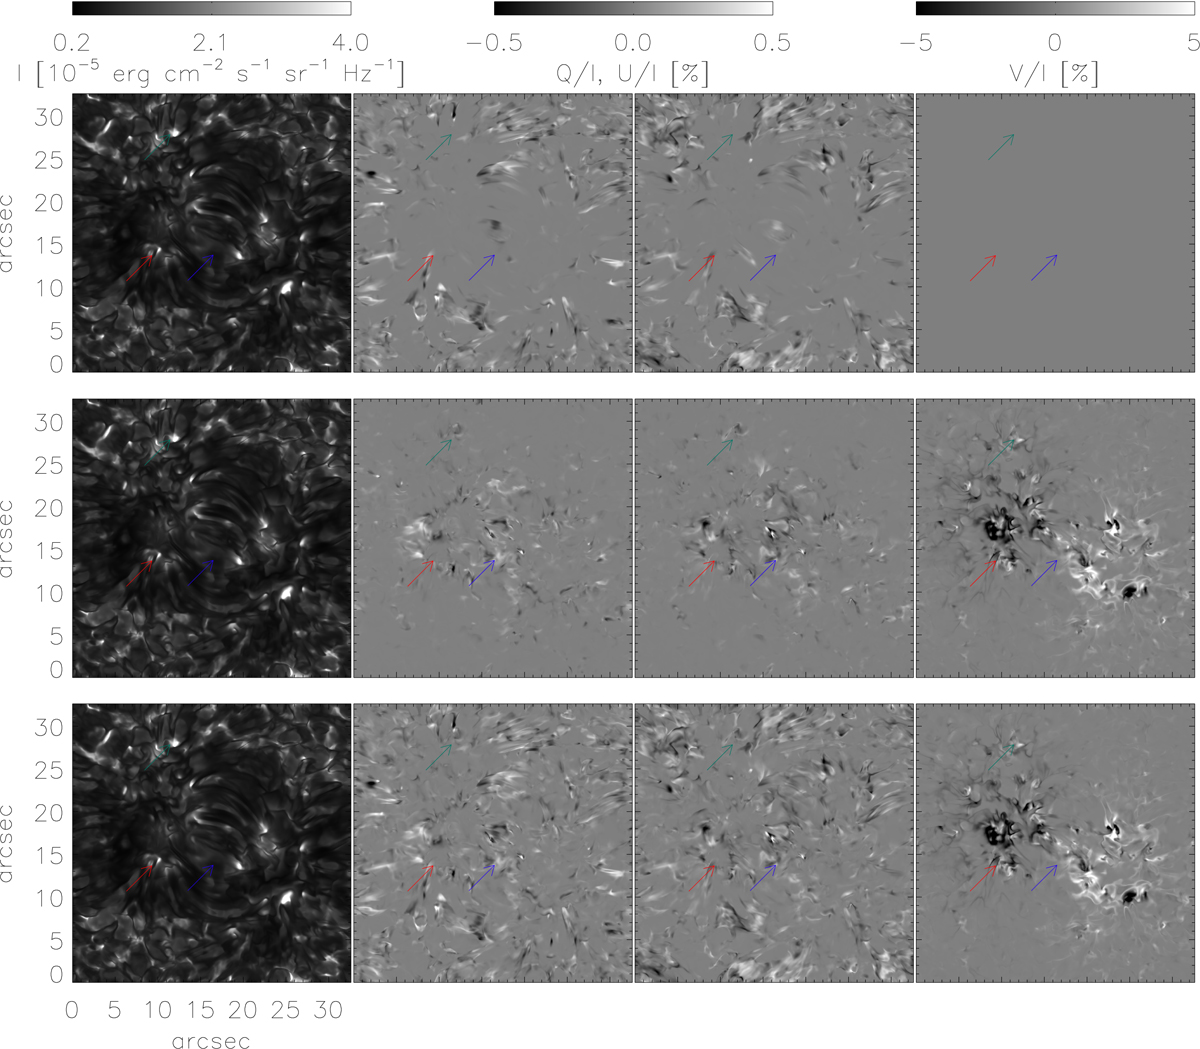
From left to right: maps of the line centre (λ = 8542.13 Å) Stokes I, Q/I, and U/I signals. The V/I signals are shown at the near-blue wing (λ = 8542 Å) of the line. We show the polarisation signals resulting from the scattering polarisation and the Hanle effect (top row), the Zeeman effect (middle row), and the joint action of the scattering polarisation and the Hanle and Zeeman effects (bottom row). The arrows point to the pixels with representative Stokes profiles, shown in Fig. 6.
Current usage metrics show cumulative count of Article Views (full-text article views including HTML views, PDF and ePub downloads, according to the available data) and Abstracts Views on Vision4Press platform.
Data correspond to usage on the plateform after 2015. The current usage metrics is available 48-96 hours after online publication and is updated daily on week days.
Initial download of the metrics may take a while.