Fig. 13.
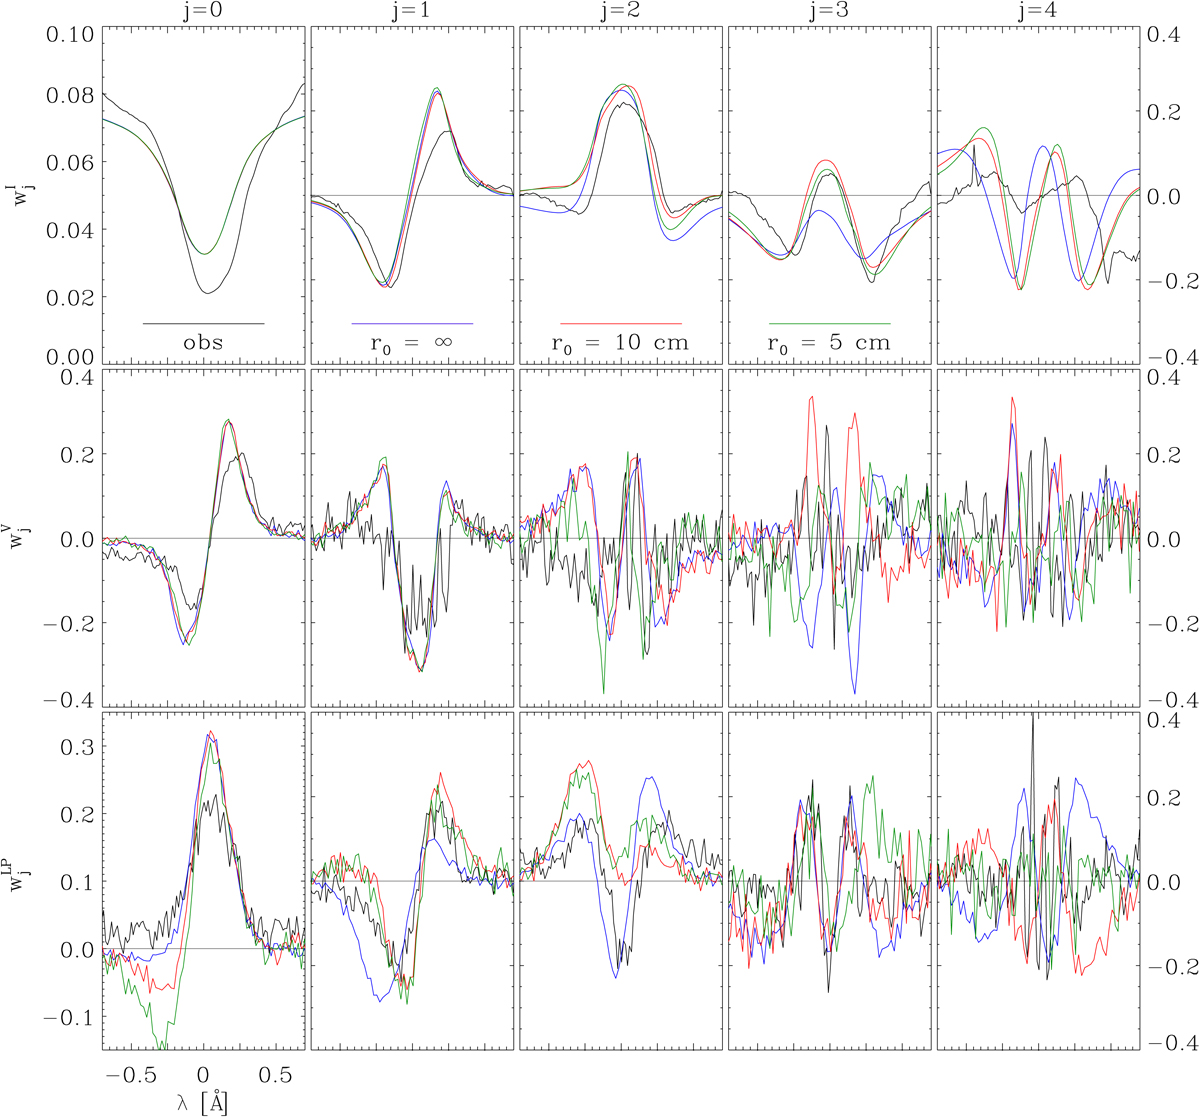
Comparison of the first eigenvectors resulting from the PCA analysis for the observed and theoretical Stokes I profiles (top row), V profiles (middle row), and linear polarisation profiles (bottom row). The black curves correspond to observations, the blue curves to the theoretical profiles that are not degraded with a spatial PSF, and the red and green curves represent the theoretical profiles degraded with PSFr0=10 cm and PSFr0=5 cm, respectively.
Current usage metrics show cumulative count of Article Views (full-text article views including HTML views, PDF and ePub downloads, according to the available data) and Abstracts Views on Vision4Press platform.
Data correspond to usage on the plateform after 2015. The current usage metrics is available 48-96 hours after online publication and is updated daily on week days.
Initial download of the metrics may take a while.