Fig. 10.
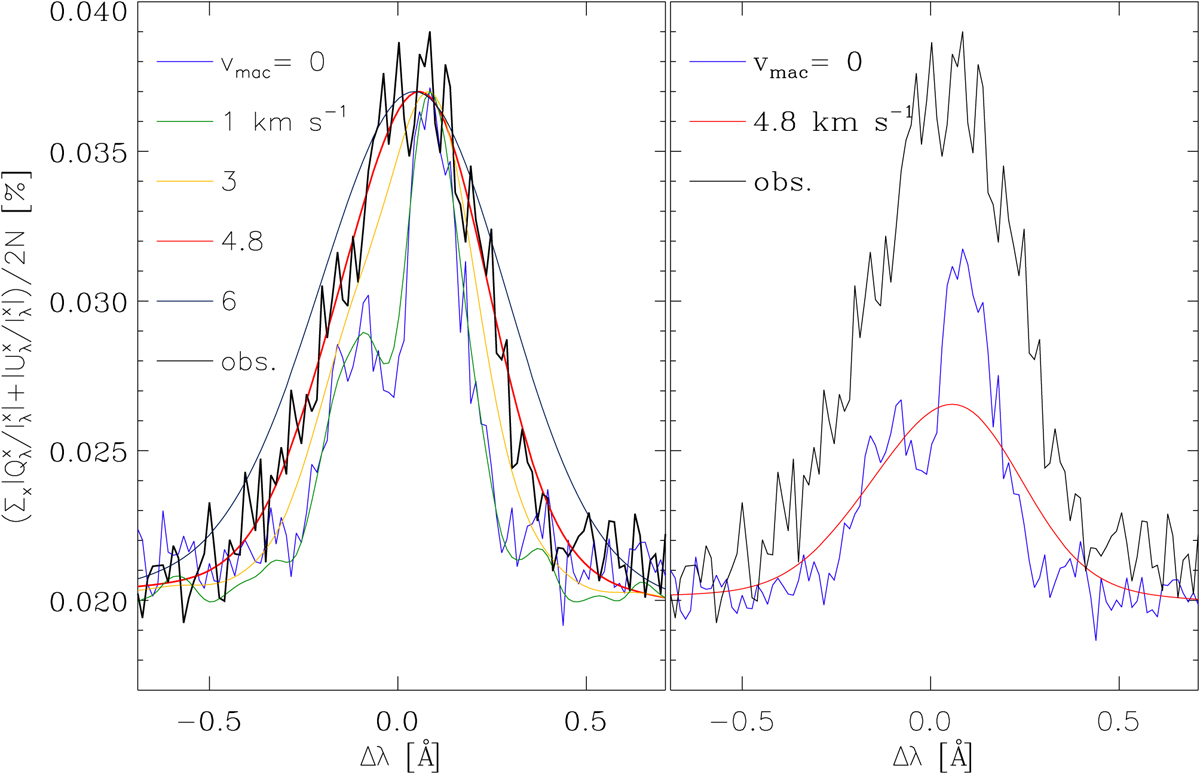
Comparison of the averaged |Q/I| and |U/I| profiles. Thick black curves correspond to the observations, coloured curves to the theoretical profile assuming PSFr0=10 cm convolved with the Gaussian functions representing macroturbulent velocities of different amplitudes. Left panel: maximum amplitudes are scaled to the observations. Right panel: actual amplitudes of the theoretical profiles.
Current usage metrics show cumulative count of Article Views (full-text article views including HTML views, PDF and ePub downloads, according to the available data) and Abstracts Views on Vision4Press platform.
Data correspond to usage on the plateform after 2015. The current usage metrics is available 48-96 hours after online publication and is updated daily on week days.
Initial download of the metrics may take a while.