Fig. 2.
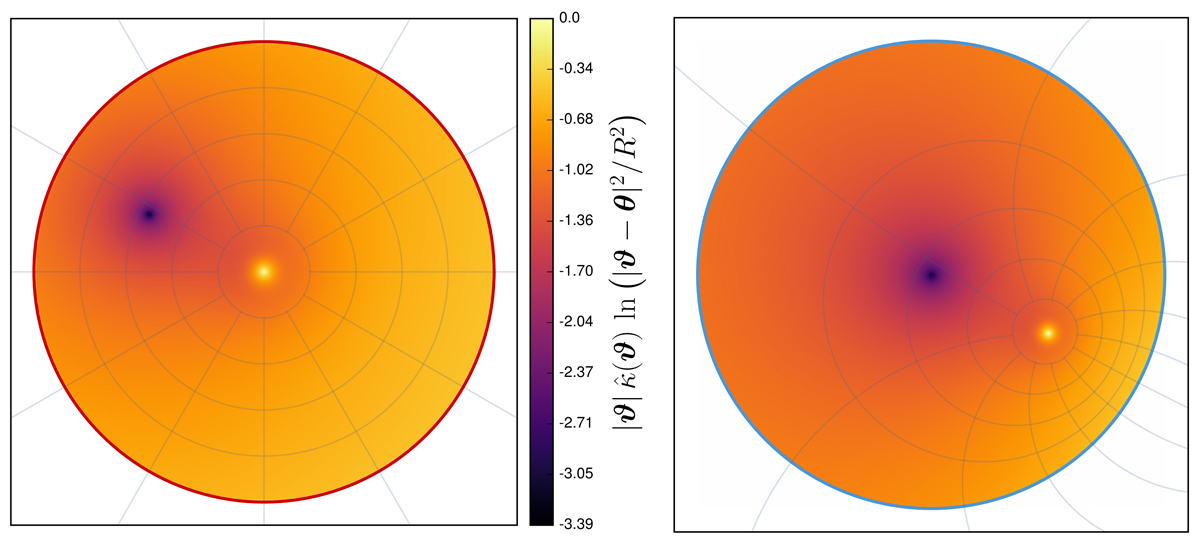
Representative example that illustrates how the integration domain 𝒰 is mapped onto the unit disk in the complex plane under a Riemann mapping. Left panel: the color coding depicts the integrand ![]() for all ϑ ∈ 𝒰. It shows a pole at ϑ = θ with θ = ( − 0.5, 0.25) θE and a secondary peak at the origin caused by κ(|ϑ|=0). The lens model is an NIS (θc = 0.1θE) plus external shear (γp = 0.1) transformed by the radial stretching
for all ϑ ∈ 𝒰. It shows a pole at ϑ = θ with θ = ( − 0.5, 0.25) θE and a secondary peak at the origin caused by κ(|ϑ|=0). The lens model is an NIS (θc = 0.1θE) plus external shear (γp = 0.1) transformed by the radial stretching ![]() with (f0, f2)=(0, 0.55). The red circle delimits 𝒰 with radius R. Right panel: integrand after applying the Riemann mapping described in Appendix A in Unruh et al. (2017). The pole ϑ = θ now lies at the origin of the unit (blue) circle of the complex plane. The polar grid (gray lines) allows us to visualize how the Riemann mapping acts on 𝒰. For this figure, we used the subpackage integrals that addresses both the pole and second peak.
with (f0, f2)=(0, 0.55). The red circle delimits 𝒰 with radius R. Right panel: integrand after applying the Riemann mapping described in Appendix A in Unruh et al. (2017). The pole ϑ = θ now lies at the origin of the unit (blue) circle of the complex plane. The polar grid (gray lines) allows us to visualize how the Riemann mapping acts on 𝒰. For this figure, we used the subpackage integrals that addresses both the pole and second peak.
Current usage metrics show cumulative count of Article Views (full-text article views including HTML views, PDF and ePub downloads, according to the available data) and Abstracts Views on Vision4Press platform.
Data correspond to usage on the plateform after 2015. The current usage metrics is available 48-96 hours after online publication and is updated daily on week days.
Initial download of the metrics may take a while.