Free Access
Fig. 3.
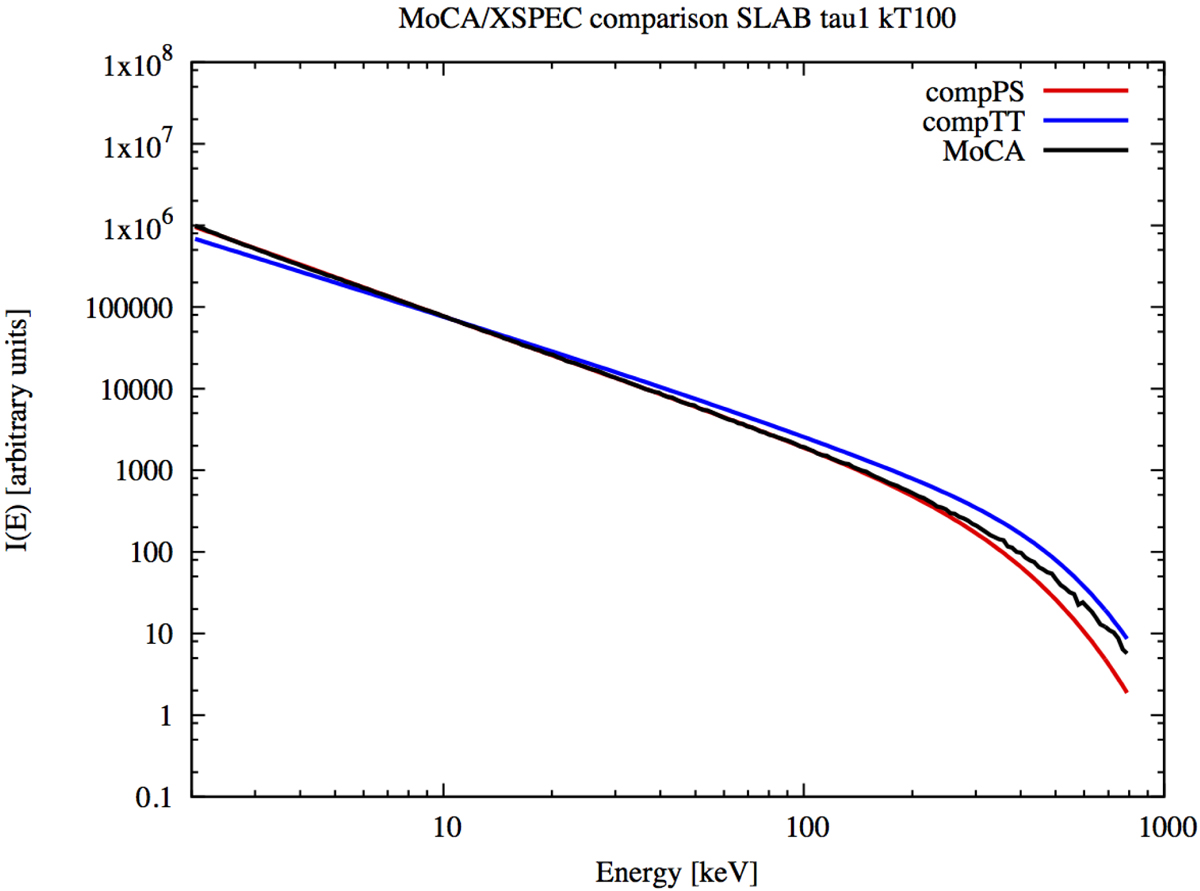
Spectral comparison between MoCA (black line) and the two semi-analytical Comptonisation model compPS and compTT as indicated inside the figure for the case of a slab corona with τ = 1 and kTe = 100 keV observed at an inclination of 60°. See text for more details.
Current usage metrics show cumulative count of Article Views (full-text article views including HTML views, PDF and ePub downloads, according to the available data) and Abstracts Views on Vision4Press platform.
Data correspond to usage on the plateform after 2015. The current usage metrics is available 48-96 hours after online publication and is updated daily on week days.
Initial download of the metrics may take a while.