| Issue |
A&A
Volume 618, October 2018
|
|
|---|---|---|
| Article Number | A160 | |
| Number of page(s) | 10 | |
| Section | Galactic structure, stellar clusters and populations | |
| DOI | https://doi.org/10.1051/0004-6361/201834050 | |
| Published online | 26 October 2018 | |
Milky Way metallicity gradient from Gaia DR2 F/1O double-mode Cepheids
1
Astronomisches Rechen-Institut, Zentrum für Astronomie der Universität Heidelberg, Mönchofstrasse 12-14, 69120 Heidelberg, Germany
e-mail: lemasle@uni-heidelberg.de
2 Instituto de Astrofísica, Pontificia Universidad Católica de Chile, Av. Vicuña Mackenna 4860, 782-0436 Macul, Santiago, Chile
3 Instituto Milenio de Astrofísica, Santiago, Chile
4 Astronomical Observatory, Odessa National University, Shevchenko Park, 65014 Odessa, Ukraine
5 Isaac Newton Institute of Chile, Odessa Branch, Shevchenko Park, 65014 Odessa, Ukraine
6 Max-Planck-Institut für Astronomie, 69117 Heidelberg, Germany
7 Dipartimento di Fisica, Università di Roma Tor Vergata, Via della Ricerca Scientifica 1, 00133 Rome, Italy
8 INAF – Osservatorio Astronomico di Roma, Via Frascati 33, 00078 Monte Porzio Catone, Rome, Italy
9 GEPI, Observatoire de Paris, CNRS, Université Paris Diderot, Place Jules Janssen, 92190 Meudon, France
10 UPJV, Université de Picardie Jules Verne, 33 rue St. Leu, 80080 Amiens, France
11 South African Astronomical Observatory, PO Box 9, 7935 Observatory, Cape Town, South Africa
12 Southern African Large Telescope Foundation, PO Box 9, 7935 Observatory, Cape Town, South Africa
13 Sternberg Astronomical Institute, Lomonosov Moscow State University, Universitetskij Pr. 13, Moscow 119992, Russia
14 Special Astrophysical Observatory of RAS, Nizhnij Arkhyz, Karachai-Circassia 369167, Russia
15 ASI Science Data Center, Via del Politecnico snc, 00133 Rome, Italy
16 Leibniz-Institut für Astrophysik Potsdam, An der Sternwarte 16, 14482 Potsdam, Germany
Received:
8
August
2018
Accepted:
13
September
2018
Context. The ratio of the first overtone (1O)/fundamental (F) periods of mixed-mode Cepheids that pulsate simultaneously in these two modes (F/1O) is metallicity-dependent. It can therefore be used to characterize the systems that host such variable stars.
Aims. We want to take advantage of the F/1O double-mode Cepheids listed in the Gaia Data Release 2 (DR2) catalog to derive the metallicity gradient in the Milky Way disk.
Methods. The metallicity is derived from the ratio of the first overtone and fundamental periods provided by Gaia DR2 while the Gaia DR2 parallaxes are used to determine the Galactocentric distances of the stars.
Results. From a visual inspection of the light curves, it turns out that a large fraction (77%) of the Galactic F/1O double-mode Cepheids in Gaia DR2 are spurious detections. Gaia DR2 provides three new bona fide F/1O Cepheids. Combining them with the currently known F/1O Cepheids and using the Gaia DR2 parallaxes for the entire sample, we can derive the metallicity gradient in the Milky Way disk. We find a slope of –0.045 ± 0.007 dex kpc−1 using a bootstrap method, and of –0.040 ± 0.002 dex kpc−1 using a total least squares method. These results are in good agreement with previous determinations of the [Fe/H] gradient in the disk based on canonical Cepheids.
Conclusions. The period ratio of F/1O Cepheids allows for a reliable determination of the metallicity gradient in the Milky Way, and in turn, in other systems that would be difficult to reach via classical spectroscopic methods.
Key words: stars: abundances / stars: distances / stars: variables: Cepheids / Galaxy: disk
© ESO 2018
1. Introduction
Cepheids are pulsating variable stars and the vast majority of them pulsates in a single mode, in general either the fundamental (F), the first-overtone (1O), or the second-overtone (2O) mode. A small fraction of the Cepheids pulsate in two modes simultaneously (in general F and 1O or 1O and 2O). A few rare objects even pulsate in three modes simultaneously (e.g., Moskalik 2014; Poretti et al. 2014; Soszyński et al. 2015).
Double-mode Cepheids have been used to test stellar evolutionary and pulsation models (e.g., Buchler & Szabó 2007; Buchler 2008; Smolec & Moskalik 2010). They have also been used to study the stellar populations of the few galaxies in which they have been discovered, namely the Milky Way (Oosterhoff 1957a,b), M 31 (Poleski 2013; Lee et al. 2013), M 33 (Beaulieu et al. 2006), the Large Magellanic Cloud (LMC; e.g., Alcock et al. 1999; Soszyński et al. 2008; Marquette et al. 2009), and the Small Magellanic Cloud (SMC; e.g., Marquette et al. 2009; Soszyński et al. 2010).
Petersen diagrams (Petersen 1973) where the period ratios of mixed-mode Cepheids are plotted versus the longer period are very useful tools to study the properties of these stars. Combined with the huge amount of data provided by the Optical Gravitational Lensing Experiment (OGLE) survey (Udalski et al. 2015), they led to numerous discoveries in recent years for both Cepheids and RR Lyrae stars (e.g., Coppola et al. 2015; Smolec et al. 2016; Prudil et al. 2017).
In Petersen diagrams, it has been known for a long time that the period ratios fall around P21 = P2/P1 = 0.80 for the Cepheids pulsating simultaneously in the first and second overtone modes (1O/2O), and around P10 = P1/P0 = 0.72 for the Cepheids pulsating simultaneously in the fundamental and first overtone modes (F/1O). Moreover, the period ratios are different for the F/1O double-mode Cepheids located in the Milky Way, the LMC, and the SMC, and these stars occupy different regions of the Petersen diagram, which is a consequence of the metallicity difference between these galaxies (e.g., Buchler & Szabó 2007). In contrast, P21 is metallicity-independent. Several authors (Sziládi et al. 2007; Kovtyukh et al. 2016) have calibrated the relation between P1/P0 and [Fe/H] using high-resolution spectroscopy of Galactic Cepheids and used it to study, for instance, the metallicity distribution of the young population in the Magellanic Clouds.
In this paper, we want to apply this same calibration relation to the F/1O double-mode Cepheids newly discovered by Gaia (Gaia Collaboration 2016, 2018) in order to derive their metallicities. Combining it with accurate distances determined directly from the Gaia Data Release 2 (DR2) parallaxes or using period-luminosity relations, we can derive the metallicity gradient in the Galactic disk. Such gradients (and their temporal evolution) provide strong constraints on the mechanisms driving the chemodynamical evolution of the Milky Way (e.g., Minchev et al. 2018; Navarro et al. 2018; Prantzos et al. 2018; Grisoni et al. 2018) and on the relative importance of, for example, stellar radial migration or the possible variation of star formation efficiency.
The paper is organized as follows: in Sect. 2 we briefly describe the sample of currently known F/1O double-mode Cepheids in the Milky Way while in Sect. 3 we analyze the new F/1O candidates in Gaia DR2. In Sect. 4 we comment on individual variable stars. Section 5 is dedicated to the determination of the Milky Way metallicity gradient. Results are summarized in Sect. 6.
2. F/1O double-mode Cepheids currently known in the Milky Way
Only 27 F/1O Cepheids are known in the Milky Way disk1. The coordinates and properties of those known for a long time are listed in the McMaster Cepheid database2, to which we added V901 Mon (Antipin 2006). A few more have been recently reported in the disk, the bulge, or the far side of the disk by the OGLE survey (Soszyński et al. 2011; Pietrukowicz et al. 2013). Kovtyukh et al. (2016) also reported the chemical composition for 18 of them. We gathered all the relevant information for the sample used in this paper in Table 1.
List of F/1O double-mode Cepheids currently known in the Milky Way.
3. New Galactic F/1O double-mode Cepheids in Gaia DR2
3.1. F/1O double-mode Cepheids in Gaia DR2
We searched for the F/1O double mode Cepheids in Gaia DR2, in the dedicated catalog for Cepheids (gaiadr2.vari_cepheid) that contains 9572 Cepheid candidates (Clementini et al. 2018). We found 162 stars for which the keyword mode_best_classification indicates “MULTI” and the multi_mode_best_classification indicates“ F/1O”.
However, a large fraction (>80%) of them are located in the Magellanic Clouds. To date, many more double-mode Cepheids have been discovered (mostly via microlensing surveys) in the LMC and SMC than in the Milky Way. For instance, OGLE (Udalski et al. 2015) reports 95 and 68 F/1O and 322 and 239 1O/2O double-mode Cepheids in the LMC and SMC, respectively. The difference between the Milky Way and the Magellanic Clouds concerning double-mode Cepheids is caused by the mean metal content affecting the topology of the instability strip (Bono et al. 2002).
Since we are not interested in the LMC and SMC Cepheids in our study of the Galactic metallicity gradient, it is an easy task to deselect them (based on their position on the sky) in order to restrict our sample to the candidate double-mode Cepheids located in the Milky Way. We are then left with 30 stars. Their properties are listed in Table 2.
Properties of candidate Galactic F/1O double-mode Cepheids in Gaia DR2.
By cross-matching these Cepheids with the 27 currently known Galactic Cepheids, we find that only four of them have been recovered by Gaia as F/1O Cepheids, namely UZ Cen, AX Vel, EY Car, and BE Pup. In Table 3, we list the periods and period ratios provided by Gaia and by the McMaster database. The periods and the period ratios are in excellent agreement.
Variability properties of double-mode Cepheids in common in the McMaster database (left panel) and Gaia DR2 (right panel).
In addition to the four stars quoted above, seven known double-mode Cepheids are identified in the gaiadr2.vari_cepheid catalog, but as single-mode pulsators, either in the fundamental (U Tra, BK Cen, GZ Car, V458 Sct, TU Cas) or in the first-overtone mode (Y Car, V825 Cas).
In order to clarify the status of the 16 remaining stars, we first checked the main Gaia catalog, which indicates that three of the known double-mode Cepheids are not recognized as variable stars, namely V367 Sct, V371 Per, and V901 Mon. Then we also investigated the gaiadr2.vari_classifier_result catalog (Holl et al. 2018). With the exception of the three stars reported as non-variable, all the double-mode Cepheids that have long been known can be found in this catalog, 15 as classical Cepheids and four as type II Cepheids (AS Cas, DZ CMa, V825 Cas, and BE Pup). It is not surprising that the gaiadr2.vari_cepheid catalog contains only a fraction of the Cepheids identified by the variability classifier, and in particular that the stars for which fewer epochs were observed are missing. We note that V825 Cas, classified as a type II Cepheid (but with a best_class_score close to 0) by the multi-stage random forest semi-supervised classifier, is tabulated as a first-overtone classical Cepheid in the gaiadr2.vari_cepheid catalog. Also BE Pup, identified as a type II Cepheid (best_class_score ≈ 0.34) by the same classifier, is properly listed as a double-mode Cepheid in the gaiadr2.vari_cepheid catalog. The five F/1O Cepheids recently discovered by OGLE are not present in the gaiadr2.vari_cepheid or in the gaiadr2.vari_classifier_result catalog.
3.2. Visual inspection of F/1O Cepheid candidates
Given the discrepancies, we decided to check the 26 (30-4) new F/1O Cepheids listed in Gaia DR2. We searched the Simbad database (Wenger et al. 2000) and the International Variable Star Index (VSX Watson et al. 2006) of the American Association of Variable Star Observers (AAVSO) for information on the F/1O Cepheid candidates. In a few cases, stars were already classified as non-Cepheid variables in different works. In clear-cut cases, we have accepted the classification provided by the authors of these works, as indicated by the comments we give upon individual variables in Sect. 4.
A number of stars have been previously classified as single-mode Cepheids, while the rest were previously unknown variables. We have visually inspected the Gaia DR2 G-band light curves of each of these variables. For some, a simple inspection of the light curve folded with the main periodicity was enough to establish the single-mode nature of these stars. For these, the limited amount of data points, together with the light curve gaps and the automated classification procedures must have led to the wrongful claim of a secondary periodicity.
The Gaia DR2 G-band light curves of the rest of the F/1O Cepheid candidates were inspected, using variability analysis based on the Discrete Fourier Transform (Deeming 1975), as implemented in the package Mufran (Kollath 1990), and the non-linear harmonic fitting routine lcfit. The main periodicities were identified in the discrete Fourier spectra of the successively pre-whitened (the so-far identified frequencies removed) light curves of the stars. For a number of variables, we have inspected photometry from other sources, mostly from the All Sky Automated Survey for SuperNovae (ASAS-SN) survey (Shappee et al. 2014; Kochanek et al. 2017) to confirm the periods appearing in the DR2 data. Examples of such analyses are shown in Fig. 1.
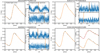 |
Fig. 1. Example light curves and power spectra of selected variables from our analysis of the Gaia DR2 F/1O double-mode Cepheid sample. For each of the four stars, the left-hand panels show the Gaia G-band light curves folded with the periodicity found by our analysis. For three stars, the smaller panels show their original (top) and whitened (bottom) power spectra in the frequency region where the fundamental and first-overtone signals are expected. On the top panels, vertical bars show the identified periodicity of each star. Meanwhile, on the bottom panels, the vertical bars show the location of the secondary periodicity given by the Gaia DR2 variability catalog (gaiadr2.vari_cepheid Clementini et al. 2018). For the last star, the right-hand panel shows light curves available for the variable in the literature (Hackstein et al. 2015), which reaffirm our analysis of the Gaia light curves. |
We have found that only three of the 26 new Galactic F/1O Cepheid candidates in Gaia DR2 can be really classified as such based on previous evidence and our analysis. These variables are listed in Sect. 3.5. For the rest of the 23 variables, we give our reasons for discarding them as F/1O Cepheids in Sect. 4.
3.3. Efficacy of F/1O Cepheid identification in Gaia DR2
Our analysis allows us to revise the efficiency of the variability analysis pipeline devised for the classification of double-mode Cepheids, when applied to the Gaia DR2 data. As mentioned before, four of the 30 F/1O Cepheid candidates were already known before, and three additional stars turned out to be real F/1O Cepheids, according to our analysis. Therefore, for the specific case of F/1O Cepheids, the precision of the Gaia DR2 sample in the Galactic field is 7/30 ∽ 23%. Furthermore, as mentioned before, 27 F/1O Cepheids have been known in the Galactic field, and this current data release has only recovered four of them, therefore the recall is 4/27 ∽ 15%. It is expected that these numbers will improve with the number of data points in the light curves in forthcoming Gaia releases.
3.4. The Petersen diagram
The Petersen diagram (Petersen 1973) is a useful tool to exploit the information on the physical properties of pulsating variable stars that pulsate in at least two modes simultaneously. It shows the period ratio PS/PL of a shorter period PS and a longer period PL as a function of PL or log PL. Observed periods are usually estimated with good accuracy and the error bars in this plot are so small that they remain invisible.
It was clear from the very beginning that the Gaia DR2 sample of F/1O double-mode Cepheids (including the Magellanic ones) was highly contaminated, since the majority of the candidates reported fall outside the locus of F/1O double-mode Cepheids in the Petersen diagram mostly based on OGLE IV data (see Fig. 2, left panel). This can arise either from a misclassification of the star or from a wrong determination of the period(s).
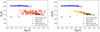 |
Fig. 2. Petersen diagrams (see text for explanations). Left panel: the entire Gaia DR2 sample of F/1O Cepheids (including those located in the Magellanic Clouds, 162 stars in total) is displayed over OGLE data for different classes of Cepheids pulsating in different modes. Previously known F/1O Cepheids in the Milky Way are shown as black crosses. Right panel: the bona fide Gaia DR2 sample of F/1O Cepheids (three stars) is displayed over OGLE data for different classes of Cepheids pulsating in different modes. Previously known F/1O Cepheids in the Milky Way are shown as black crosses. |
In Fig. 2 (right panel), we show the Petersen diagram including only the confirmed Galactic candidates. Two out of the three new F/1O Cepheids fall well within the locus occupied by the Milky Way F/1O Cepheids.
3.5. New Galactic F/1O Cepheids from Gaia DR2
2166389269407411200. This variable is V1533 Cyg, listed by Simbad as an RR Lyrae variable, based on the classification of Hoffman et al. (2009). However, Wils & Greaves (2004) list this star as a Cepheid. Our analysis of the ASAS-SN data supports the latter classification as a Cepheid variable, pulsating simultaneously in the fundamental and first-overtone modes with the periods given by Gaia DR2. 5369956245371775104. Our analysis confirms that this star is a real F/1O double-mode Cepheid.
5845572265108049408. Analyses of the Gaia light curve have revealed that the Gaia DR2 period given for the first overtone, 0.79647 days, is an alias of the real secondary period, 0.76426 days. The ASAS-SN light curve confirms our finding, resulting in a decrease of the period ratio from 0.7330 to 0.7034.
In the following, these stars are sometimes identified (for convenience reasons) as Gaia1, Gaia2, and Gaia3, respectively.
4. Stars misclassified as Galactic F/1O Cepheids
462252662762965120. This variable is AC Cam, a known fundamental-mode classical Cepheid. Analysis of the Gaia light curve does not provide convincing evidence for a secondary pulsation mode, as illustrated by the top left panels of Fig. 1. 466906311366699520. This star, also known as ASASSN-V J031346.98+632052.8, has been reported to be a fundamental-mode classical Cepheid by Jayasinghe et al. (2018). Likewise, the Gaia light curve does not show evidence of a secondary periodicity, as shown by the bottom left panels of Fig. 1.
514736269771300224. We have found no evidence of additional periodicities in the Gaia light curve besides the claimed first-overtone period. Inspection of the ASAS-SN light curve supports this result, and the light curve shape suggests the classification of this variable as a first-overtone Cepheid.
1693501722163309312. This variable is associated with the Ursa Minor dwarf galaxy, with a membership probability of 0.96 (Eskridge & Schweitzer (2001), ID 296 in their Table 1). Its position above the horizontal branch (HB), and relatively long pulsation period of ∽0.7637 days, suggest that this object is a post-zero-age horizontal branch (ZAHB) star crossing the instability strip. There is no sign of additional periodicities in the light curve.
1807821313362785664. Inspection of the Gaia light curve reveals that for the main periodicity of ∽4.091437 days, the entirety of the rising branch is missing, which, coupled with the relatively high scatter due to the faintness of the star, has led to the incorrect classification of this variable as an F/1O Cepheid.
1823617898156364160. There is no sign of an additional mode in the Gaia light curve of this variable besides the fundamental mode. Its similar period and light curve shape suggests the same variability type as 4221891970813502464.
3036328405518444800. Analysis of the Gaia light curve does not provide evidence for the claimed secondary period. The light curve is missing the rising branch, when folded with the main period, which together with the small amplitude (∽0.3 mag) prevents the identification of the variable class of this star.
3068089482512577152. Neither the Gaia nor the ASAS-SN light curves of this star show any sign of the claimed secondary period. Due to the relatively low total amplitude (∽0.35 mag in G) and the phase gap on the descending branch of the light curve, the type of this variable is uncertain.
3103637208835609728. This candidate Cepheid is the active star ASAS J063656-0521.0, analyzed in detail by Savanov (2014). We note that active and/or spotted stars have been known to masquerade as pulsating variables when the length of photo-metric observations and/or the methods of analysis do not allow for a clear distinction (e.g., Pietrukowicz et al. 2015).
4038015379997952512. This star is the peculiar variable V725 Sgr. Swope & Shapley (1937) reported this star to be pulsating with a period that increased from 12 days in 1926, to 21 days in 1935. Since then, the star has become a semi-regular variable with a period of ∽90 days (Percy et al. 2006), though even more recently it has also been reported to be an irregular variable (Battinelli & Demers 2010). The low number of Gaia G epochs (18) led to the misclassification of this variable as an F/1O Cepheid.
4221891970813502464. This star has been classified as an AHB1/XX Vir variable3 (Sandage & Tammann 2006) by Jayasinghe et al. (2018), based on photometry from the ASASSN survey, under the name ASASSN-V J200242.48-033634.4. The light curve is monoperiodic without any additional mode. 4265371574109405824. This variable is the fundamental-mode classical Cepheid V493 Aql. There is no hint of a secondary periodicity in the light curve, but the inspection of the folded Gaia light curve on Fig. 1 reveals phase gaps, which probably led to the incorrect classification of this variable.
4346080262981428224. This variable was classified as a binary under the name CSS_J155623.7-111836 by Drake et al. (2014). Our analysis of the Gaia light curve supports the claimed fundamental period of ∽3.41711 days, but we find no evidence of a secondary periodicity. Based on the light curve shape, this variable is most probably of the BL Her type.
4549519051176647808. This star is likely a binary (probably of EA (Algol) type), with twice the period given for the fundamental mode in the Gaia variability catalog, ∽12.117 days.
4578235236881587968. This star does not show a secondary period in its light curve. The relatively high scatter due to its faintness, as well as its total variability amplitude of only ∽0.35 mag, do not permit an unambiguous classification of variability type.
5431347477101421824. The light curve shows a major gap on the rising branch when folded with the period of the claimed fundamental mode. Analysis of the ASAS-SN light curve does not show the claimed first-overtone period, but reveals changes in the mean magnitude of the variable on a yearly timescale, indicating that this star is probably an active star like 3103637208835609728, despite being classified as a Cepheid by Jayasinghe et al. (2018).
5593427031607304704. The analysis of the Gaia and ASAS-SN light curves did not reveal any sign of additional periodicity. The light curve shape indicates that this variable is a first-overtone classical Cepheid.
5594100246268225280. Inspection of the Gaia light curve folded with the period given for the first-overtone mode unambiguously reveals the single, fundamental mode nature of this variable. We note that the r′ and i′-band photometry published by Hackstein et al. (2015; for source GDS_J0759223-332125) also supports that classification of this variable, as illustrated by the bottom right-hand panels of Fig. 1.
5599566983722741248. This variable has been classified as a fundamental-mode classical Cepheid by Jayasinghe et al. (2018). The Gaia light curve presents significant phase gaps when folded with the pulsation period, probably leading to the misclassification of this variable as an F/1O Cepheid.
5895841249526120064. This star has a total amplitude of only ∽0.13 mag in the Gaia G-band light curve, and no sign of a secondary periodicity. The slight asymmetry of the light curve hints at fundamental mode pulsation, as either a BL Her or a classical Cepheid variable.
6117651360865355136. This star is the RV Tau type variable V820 Cen. It has only 19 epochs in the Gaia G-band, leading to its misclassification.
6394890542044709888. This star is ASASSN-V J031346.98 + 632052.8, classified as a small-amplitude classical Cepheid (DCEPS) by Jayasinghe et al. (2018). There is no sign of additional periodicities in either the Gaia or the ASAS-SN light curves. We do note that its low Galactic latitude (− 49.795 deg) and faintness would lead to a large inferred distance from the Galactic disk, if the classification as a classical Cepheid held true for this variable, therefore it is most probably some other kind of variable. 6710614339593008384. This variable is the RRab star SSS_J185900.5-462532 (Torrealba et al. 2015), with a pulsation period of ∽0.53518 days. The low number of Gaia epochs (15) has led to the misclassification of this variable.
5. Galactic metallicity gradient
5.1. Galactocentric distance
For all but two stars in our sample (that have negative parallaxes), we can derive the heliocentric (and, in turn, Galactocentric) distance by inverting the parallax value provided by Gaia DR2. In Fig. 3 we compare those distances to the distances computed by Bailer-Jones et al. (2018) using a purely geometrical distance prior relying on a model of the Milky Way.
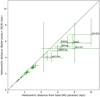 |
Fig. 3. Comparison of the heliocentric distance computed by inverting the Gaia DR2 parallax to the heliocentric distance derived by Bailer-Jones et al. (2018) using a geometrical distance prior. |
Both sets of distances are in excellent agreement as long as the stars are located within ∼4–5 kpc from the Sun, a distance beyond which the distance estimates start to diverge. This is presumably due to the combined effect of the decreasing accuracy of the Gaia parallaxes at large distances and of the uncertainties of the Galaxy model from which the priors are determined.
Photometric distances (Genovali et al. 2014) based on reddening-free period-Wesenheit4 relations in the near-infrared (Inno et al. 2013) are also available for some of the stars in our sample, however the accuracy of those distances is not homogeneous: in the absence of near-infrared time-series data, some of them have been derived using a single-point value taken from the Two Micron All Sky Survey (2MASS) together with light curve templates. Photometric Galactocentric distances are nevertheless in excellent agreement with Gaia parallax-based distances as shown in Fig. 4. The small divergence observed in the inner part of the disk is presumably related to increasing uncertainties on the reddening law and individual reddening values at large distances in the disk. Since they are available for all but two Milky Way F/1O Cepheids, we used distances directly derived by inverting the Gaia DR2 parallax in the rest of the paper.
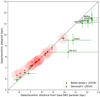 |
Fig. 4. Comparison of the Galactocentric distances computed using Gaia DR2 parallaxes only, or combining them with a geometrical distance prior (Bailer-Jones et al. 2018). Galactocentric distances derived from near-infrared photometry (Inno et al. 2013; Genovali et al. 2014) and their associated error bars are shown in red. For comparison purposes, all the distances have been computed assuming that the Sun is located at 7.94 kpc from the Galactic center (Matsunaga et al. 2013). |
5.2. Spatial distribution of the F/1O Cepheids in our sample and sample selection
Figure 5 shows the spatial distribution of the F/1O Cepheids in the Milky Way. The location of the stars has been computed using the inverse of the Gaia DR2 parallaxes as heliocentric distance, and two of the Cepheids in the OGLE disk sample are therefore missing because they have negative parallaxes in Gaia DR2.
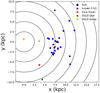 |
Fig. 5. Spatial distribution of the F/1O Cepheids in the Milky Way. The currently known F/1O Cepheids are shown in blue, and in yellow and green for the bulge and disk Cepheids in the OGLE sample of Soszyński et al. (2011) and Pietrukowicz et al. (2013), respectively. The new F/1O Cepheids in Gaia DR2 are shown in red. |
For the derivation of the gradient, we did not include the OGLE Cepheids in the disk or towards the bulge. As already mentioned, two of the disk ones have negative parallaxes in Gaia DR2 and no homogeneous distances can be determined for these stars. Moreover, the exact location of the OGLE Cepheids towards the bulge remains quite uncertain, one of them being even placed in the flared outer disk at the far side of our Galaxy by Feast et al. (2014).
Furthermore, all but one of the OGLE F/1O Cepheids have fundamental periods shorter than two days, while the relation of Kovtyukh et al. (2016) has been calibrated with F/1O Cepheids with fundamental periods spanning a [2d–6d] range. Metallicities derived by applying this formula to shorter period Cepheids might be inaccurate, as seems to be the case for the F/1O Cepheid Gaia3, with a fundamental period slightly larger than one day.
5.3. Computation of the gradient: method
Our sample of F/1O Cepheids adopted to derive the Milky Way metallicity gradient therefore contains 25 stars, including the three new F/1O Cepheids discovered by Gaia. The determina tion of the gradient requires both distances and metallicities for the stars in our sample. Here we use a simple bootstrap method to derive the slope and the intercept of the gradient and their standard deviation.
The first step in our analysis consists in estimating the error on the metallicity derived using the Kovtyukh et al. (2016) relation. To achieve this goal, we have generated 10 000 relations between [Fe/H], log(P0), and P1/P0 in a multivariate normal (Gaussian) distribution, for which we use as input parameters the coefficients and the covariance matrix of the function fitted by Kovtyukh et al. (2016). For a given Cepheid, the standard deviation of the 10000 values of [Fe/H] generated is adopted as the error on the metallicity. Having estimated the errors on the metallicity, we can now draw random metallicities assuming a normal distribution around the value given by the Kovtyukh et al. (2016) formula.
For the distances, we draw random parallaxes assuming a normal distribution of the error on the parallax, where the value reported by Gaia DR2 is considered as the standard deviation of the distribution. This parallax is converted into heliocentric and then Galactocentric distance RG. We assume a Galactocentric distance of 7.94 kpc for the Sun, in order to enable a direct comparison with the gradient obtained by Genovali et al. (2014) for numerous Cepheids pulsating in various modes. We investigated the influence of the adopted solar Galactocentric distance and results are given in Table 5.
Galactocentric distances derived from Gaia DR2 parallaxes (Gaia Collaboration 2018), Gaia DR2 parallaxes combined with a geometrical prior (Bailer-Jones et al. 2018), or period-Wesenheit relations in the near-infrared (Inno et al. 2013; Genovali et al. 2014).
Influence of the adopted distance to the Galactic center on the slope and intercept of the metallicity gradient.
We realize 10 000 drawings of distances and metallicities for the 25 stars in our sample, which means that for a given population we draw 25 (distance, metallicity) pairs, and we repeat the operation 10 000 times. We then fit a linear gradient to each of these populations and obtain 10 000 slopes and intercepts. Their means and standard deviations give us the slope and intercept of the Galactic metallicity gradient and associated errors.
5.4. Computation of the gradient: alternative method
We also computed the Milky Way metallicity gradient using a total least squares regression (Hogg et al. 2010), as implemented in the astroML python package (VanderPlas et al. 2012; Ivezić et al. 2014). With this method, observational errors on both variables RG and [Fe/H] are taken into account. For a given star, the standard deviation of the 10 000 realizations of RG computed for the bootstrap method is adopted as the uncertainty on RG. In this case, for every Cepheid, the two quantities (RG, [Fe/H]) are independently determined, therefore their estimates are not correlated. We note, however, that the distributions of the uncertainties (especially on RG) are not exactly Gaussian.
5.5. Results
With the bootstrap method, we obtain a slope of −0.0447 ± 0.0066 dex kpc−1 for the gradient (see Fig. 6), in good agreement with the values obtained by, for example, Lemasle et al. (2007; –0.061 ± 0.19 dex kpc−1), Lemasle et al. (2008; –0.052 ± 0.03 dex kpc−1), or the own sample of Genovali et al. (2014; –0.052 ± 0.004 dex kpc−1). This slope is slightly lower than the slope derived by Genovali et al. (2014; –0.055 ± 0.002 dex kpc−1) combining their data with literature values adjusted to a common metallicity scale; it is also lower than that obtained by Luck et al. (2011) and Luck & Lambert (2011) who found slopes of –0.055 ± 0.003 and –0.062 ± 0.002 dex kpc−1, respectively. A comparison of the slopes mentioned here can also be found in Fig. 7. It is also worth mentioning that the range in Galactocentric distances covered by the different estimates of the metallicity gradient changes between the different samples. The agreement remains reasonable with the total least squares method (Fig. 8), which gives a (shallower) slope of –0.040 ± 0.002 dex kpc−1.
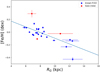 |
Fig. 6. Metallicity gradient in the disk where distances and metallicities are the nominal values derived from the Gaia DR2 parallaxes and the Kovtyukh et al. (2016) relation, respectively. The color coding is the same as in Fig. 5. The slope and the intercept of the gradient have been computed using a bootstrap method (see Sect. 5.3). |
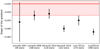 |
Fig. 7. Comparison of the slopes of the present-day [Fe/H] gradient derived from Cepheids in different studies (Lemasle et al. 2007, 2008; Luck et al. 2011; Luck & Lambert 2011; Genovali et al. 2014). Slopes and error bars are shown in black while the red line and red area represent the result of the current study using 24 F/1O Cepheids (Bootstrap method, Rg⊙ = 7.94 kpc). |
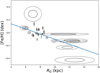 |
Fig. 8. Metallicity gradient in the disk where distances and metallicities are the nominal values derived from the Gaia DR2 parallaxes and the Kovtyukh et al. (2016) relation, respectively. The slope and the intercept of the gradient have been computed using a total least square method (see Sect. 5.4). The ellipses trace the 1-σ and 2-σ likelihood contours. |
As can be seen in Fig. 8, the uncertainties on both [Fe/H] and the Galactocentric distance are small for the nearby Cepheids, because their parallaxes could be determined with a good accuracy. In contrast, the less accurate parallaxes for distant Cepheids lead to stars that are at best only marginally consistent with the computed slope. Better parallaxes at large distances from Gaia DR2 and a larger sample of F/1O Cepheids in the outer disk would help to better constrain the metallicity gradient in this region.
Only one star has a very large uncertainty on metallicity. It is one of the newly discovered F/1O Cepheids, and the uncertainty on the derived metallicity may be related to the fact that its fundamental period (≈1d) falls out of the range of periods ([2d–6d]) for which the Kovtyukh et al. (2016) relation was calibrated. Despite its also quite large uncertainty on the distance, it is unlikely that this Cepheid would follow the general trend if the error bars on the measurements were reduced. This could indicate that the star was born in a slightly different environment than the other Cepheids, and indeed Fig. 5 shows that it is located in a different region of the disk. Alternatively it could prove that the current relation between P1/P0 and [Fe/H] no longer holds at short periods.
The quoted results were obtained assuming that the Sun is located at 7.94 kpc from the Galactic center, in order to allow for direct comparisons with the values obtained by Genovali et al. (2014). These authors adopted this distance as it was derived from similar tracers (classical Cepheids) discovered in the Galactic nuclear bulge by Matsunaga et al. (2013). We checked, however, that with both the bootstrap and total least squares methods, the slope and intercept of the gradient are only marginally affected by the choice of other values (8.0 kpc, 8.3 kpc) for Rg ⊙. Results are tabulated in Table 5.
In distant systems, metallicity gradients derived from observations usually refer to the [O/H] gradient measured in HII regions or planetary nebulae. In addition to the intrinsic uncertainties related to the abundance determination in such tracers, the comparison with iron gradients derived from Cepheids requires the transformation of the measured [O/H] into Z or [Fe/H], which may vary from system to system or even within the observed system. With these caveats in mind, it is interesting to note that Beaulieu et al. (2006) found a good agreement between their gradients and those derived from HII regions (e.g., Garnett et al. 1997), B supergiants (e.g., Urbaneja et al. 2005), or planetary nebulae (e.g., Magrini et al. 2004) in M 33. In M 31, Lee et al. (2013) report a good agreement between their double-mode Cepheids gradient and the gradient derived from HII regions (Sanders et al. 2012; Zurita & Bresolin 2012), but the agreement is surprisingly even better with the slope derived by Kwitter et al. (2012) from planetary nebulae. Our study validates the use of metallicity gradients derived from F/1O Cepheid period ratios through direct comparison to those obtained using full spectroscopic analyses of related objects, the single-mode classical Cepheids.
6. Conclusions
We have identified only three new Galactic F/1O Cepheids within the 30 Gaia DR2 candidates. After inspection of their light curves and with the help of the literature, we propose an alternative classification for the remaining stars. With a larger number of individual measurements and hence better populated light curves, it is very likely that the number of genuine F/1O Cepheids will increase in the future Gaia releases.
Thanks to the accurate Gaia DR2 parallaxes, we have derived Galactocentric distances for almost the entire sample of known Galactic F/1O Cepheids. Taking advantage of the metallicity dependence of the P1/P0 ratio, we have derived the present-day Milky Way metallicity gradient in the thin disk. The slope of −0.045 ± 0.007 dex kpc−1 is in good agreement with the gradient determined using Cepheids pulsating in various modes, which validates the use of F/1O Cepheids to derive metallicity gradients. We recommend high resolution spectroscopic follow-up of short-period F/1O Cepheids in order to extend the period range over which the Kovtyukh et al. (2016) relation is applicable.
A similar number of 1O/2O double-mode Cepheids (that are not relevant for this paper) have also been discovered: CO Aur and V1048 Cen have been known for a long time; V767 Sgr, and V363 Cas have been reported by Hajdu et al. (2009), and several more stars have been identified by, for example, Soszyński et al. (2011), Pietrukowicz et al. (2013), Khruslov (2013), and Khruslov & Kusakin (2016) in large scale photo-metric surveys.
For the relation between AHB, XX Vir, BL Her, and type II Cepheids more generally, the reader is referred to Sect. 7.2 in Catelan & Smith (2015).
Wesenheit indices are pseudo-magnitudes related to apparent magnitudes, but minimally affected by uncertainties on reddening by construction (see Madore 1982). They were computed using the reddening law of Cardelli et al. (1989).
Acknowledgments
We thank the anonymous referee for her or his suggestions that helped to improve the quality of the paper. B.L., G.H., L.I., and E.K.G. acknowledge support from the Sonderforschungsbereich SFB 881 “The Milky Way System” (sub-projects A3, A5) of the German Research Foundation (DFG). Additional support for M.C. and G.H. for this project is provided by Fondecyt through grant #1171273; the Ministry for the Economy, Development, and Tourism’s Millennium Science Initiative through grant IC 120009, awarded to the Millennium Institute of Astrophysics (MAS); by Proyecto Basal PFB-06/2007; and by CONICYT’s PCI program through grant DPI20140066. G.H. acknowledges additional support from the Graduate Student Exchange Fellowship Program between the Institute of Astrophysics of the Pontificia Universidad Católica de Chile and the Zentrum für Astronomie der Universität Heidelberg, funded by the Heidelberg Center in Santiago de Chile and the Deutscher Akademischer Austauschdienst (DAAD), and by the CONICYT-PCHA/Doctorado Nacional grant 2014-63140099. A.K. acknowledges the National Research Foundation of South Africa and the Russian Science Foundation (project no. 14-50-00043). This work has made use of data from the European Space Agency (ESA) mission Gaia (https://www.cosmos.esa.int/gaia), processed by the Gaia Data Processing and Analysis Consortium (DPAC, https://www.cosmos.esa.int/web/gaia/dpac/consortium). Funding for the DPAC has been provided by national institutions, in particular the institutions participating in the Gaia Multilateral Agreement. This research has made use of the SIMBAD database, operated at CDS, Strasbourg, France (Wenger et al. 2000). This research has made use of the International Variable Star Index (VSX) database, operated at AAVSO, Cambridge, Massachusetts, USA. This research has made use of the TOPCAT5 software (Taylor 2005). This research has made use of the numpy, scipy, matplotlib (Hunter 2007), astropy (Astropy Collaboration 2018), iPython, and astroML (VanderPlas et al. 2012; Ivezić et al. 2014) python packages.
References
- Alcock, C., Allsman, R. A., Alves, D., et al. 1999, ApJ, 511, 185 [NASA ADS] [CrossRef] [Google Scholar]
- Antipin, S. V. 2006, Peremennye Zvezdy Prilozhenie, 6 [Google Scholar]
- Astropy Collaboration (Price-Whelan, A. M., et al.) 2018, AJ, 156, 123 [Google Scholar]
- Bailer-Jones, C. A. L., Rybizki, J., Fouesneau, M., Mantelet, G., & Andrae, R. 2018, AJ, 158, 58 [NASA ADS] [CrossRef] [Google Scholar]
- Battinelli, P., & Demers, S. 2010, PASP, 122, 144 [NASA ADS] [CrossRef] [Google Scholar]
- Beaulieu, J.-P., Buchler, J. R., Marquette, J.-B., Hartman, J. D., & Schwarzenberg-Czerny, A. 2006, ApJ, 653, L101 [NASA ADS] [CrossRef] [Google Scholar]
- Bono, G., Groenewegen, M. A. T., Marconi, M., & Caputo, F. 2002, ApJ, 574, L33 [NASA ADS] [CrossRef] [Google Scholar]
- Buchler, J. R. 2008, ApJ, 680, 1412 [NASA ADS] [CrossRef] [Google Scholar]
- Buchler, J. R., & Szabó, R. 2007, ApJ, 660, 723 [NASA ADS] [CrossRef] [Google Scholar]
- Camarillo, T., Mathur, V., Mitchell, T., & Ratra, B. 2018, PASP, 130, 024101 [NASA ADS] [CrossRef] [Google Scholar]
- Cardelli, J. A., Clayton, G. C., & Mathis, J. S. 1989, ApJ, 345, 245 [NASA ADS] [CrossRef] [Google Scholar]
- Catelan, M., & Smith, H. A. 2015, Pulsating Stars (Wiley-VCH) [CrossRef] [Google Scholar]
- Clementini, G., Ripepi, V., Molinaro, R., et al. 2018, A&A, submitted [arXiv:1805.02079] [Google Scholar]
- Coppola, G., Marconi, M., Stetson, P. B., et al. 2015, ApJ, 814, 71 [NASA ADS] [CrossRef] [Google Scholar]
- Deeming, T. J. 1975, Ap&SS, 36, 137 [NASA ADS] [CrossRef] [MathSciNet] [Google Scholar]
- de Grijs, R., & Bono, G. 2016, ApJS, 227, 5 [NASA ADS] [CrossRef] [Google Scholar]
- Drake, A. J., Graham, M. J., Djorgovski, S. G., et al. 2014, ApJS, 213, 9 [NASA ADS] [CrossRef] [Google Scholar]
- Eskridge, P. B., & Schweitzer, A. E. 2001, AJ, 122, 3106 [NASA ADS] [CrossRef] [Google Scholar]
- Feast, M. W., Menzies, J. W., Matsunaga, N., & Whitelock, P. A. 2014, Nature, 509, 342 [NASA ADS] [CrossRef] [PubMed] [Google Scholar]
- Gaia Collaboration (Prusti, T., et al.) 2016, A&A, 595, A1 [NASA ADS] [CrossRef] [EDP Sciences] [Google Scholar]
- Gaia Collaboration (Brown, A. G. A., et al.) 2018, A&A, 616, A1 [NASA ADS] [CrossRef] [EDP Sciences] [Google Scholar]
- Garnett, D. R., Shields, G. A., Skillman, E. D., Sagan, S. P., & Dufour, R. J. 1997, ApJ, 489, 63 [NASA ADS] [CrossRef] [Google Scholar]
- Genovali, K., Lemasle, B., Bono, G., et al. 2014, A&A, 566, A37 [NASA ADS] [CrossRef] [EDP Sciences] [Google Scholar]
- Grisoni, V., Spitoni, E., & Matteucci, F. 2018, MNRAS, 481, 2570 [NASA ADS] [Google Scholar]
- Groenewegen, M. A. T., Udalski, A., & Bono, G. 2008, A&A, 481, 441 [NASA ADS] [CrossRef] [EDP Sciences] [Google Scholar]
- Hackstein, M., Fein, C., Haas, M., et al. 2015, Astron. Nachr., 336, 590 [NASA ADS] [CrossRef] [Google Scholar]
- Hajdu, G., Jurcsik, J., & Sodor, A. 2009, IBVS, 5882 [Google Scholar]
- Hoffman, D. I., Harrison, T. E., & McNamara, B. J. 2009, AJ, 138, 466 [NASA ADS] [CrossRef] [Google Scholar]
- Hogg, D. W., Bovy, J., & Lang, D. 2010, ArXiv e-prints [arXiv:1008.4686] [Google Scholar]
- Holl, B., Audard, M., Nienartowicz, K., et al. 2018, A&A, 618, A30 [NASA ADS] [CrossRef] [EDP Sciences] [Google Scholar]
- Hunter, J. D. 2007, Comput. Sci. Eng., 9, 90 [Google Scholar]
- Inno, L., Matsunaga, N., Bono, G., et al. 2013, ApJ, 764, 84 [NASA ADS] [CrossRef] [Google Scholar]
- Ivezić, Ž., Connelly, A. J., VanderPlas, J. T., & Gray, A. 2014, Statistics, Data Mining, and Machine Learningin Astronomy (Princeton University Press) [Google Scholar]
- Jayasinghe, T., Kochanek, C. S., Stanek, K. Z., et al. 2018, MNRAS, 477, 3145 [NASA ADS] [CrossRef] [Google Scholar]
- Khruslov, A. V. 2013, Astron. Nachr., 334, 866 [NASA ADS] [CrossRef] [Google Scholar]
- Khruslov, A. V., & Kusakin, A. V. 2016, ArXiv e-prints [arXiv:1605.01313] [Google Scholar]
- Kochanek, C. S., Shappee, B. J., Stanek, K. Z., et al. 2017, PASP, 129, 104502 [NASA ADS] [CrossRef] [Google Scholar]
- Kollath, Z. 1990, Konkoly Observatory Occasional Technical Notes, 1 [Google Scholar]
- Kovtyukh, V., Lemasle, B., Chekhonadskikh, F., et al. 2016, MNRAS, 460, 2077 [NASA ADS] [CrossRef] [Google Scholar]
- Kwitter, K. B., Lehman, E. M. M., Balick, B., & Henry, R. B. C. 2012, ApJ, 753, 12 [NASA ADS] [CrossRef] [Google Scholar]
- Lee, C.-H., Kodric, M., Seitz, S., et al. 2013, ApJ, 777, 35 [NASA ADS] [CrossRef] [Google Scholar]
- Lemasle, B., François, P., Bono, G., et al. 2007, A&A, 467, 283 [NASA ADS] [CrossRef] [EDP Sciences] [Google Scholar]
- Lemasle, B., François, P., Piersimoni, A., et al. 2008, A&A, 490, 613 [NASA ADS] [CrossRef] [EDP Sciences] [Google Scholar]
- Luck, R. E., & Lambert, D. L. 2011, AJ, 142, 136 [NASA ADS] [CrossRef] [Google Scholar]
- Luck, R. E., Andrievsky, S. M., Kovtyukh, V. V., Gieren, W., & Graczyk, D. 2011, AJ, 142, 51 [NASA ADS] [CrossRef] [Google Scholar]
- Madore, B. F. 1982, ApJ, 253, 575 [NASA ADS] [CrossRef] [Google Scholar]
- Magrini, L., Perinotto, M., Mampaso, A., & Corradi, R. L. M. 2004, A&A, 426, 779 [NASA ADS] [CrossRef] [EDP Sciences] [Google Scholar]
- Majaess, D., Dékány, I., Hajdu, G., et al. 2018, Ap&SS, 363, 127 [Google Scholar]
- Marquette, J. B., Beaulieu, J. P., Buchler, J. R., et al. 2009, A&A, 495, 249 [NASA ADS] [CrossRef] [EDP Sciences] [Google Scholar]
- Matsunaga, N., Feast, M. W., Kawadu, T., et al. 2013, MNRAS, 429, 385 [NASA ADS] [CrossRef] [Google Scholar]
- Minchev, I., Anders, F., Recio-Blanco, A., et al. 2018, MNRAS, 481, 1645 [NASA ADS] [CrossRef] [Google Scholar]
- Moskalik, P. 2014, in Precision Asteroseismology, eds. J. A. Guzik, W. J. Chaplin, G. Handler, & A. Pigulski, IAU Symp., 301, 249 [NASA ADS] [Google Scholar]
- Navarro, J. F., Yozin, C., Loewen, N., et al. 2018, MNRAS, 476, 3648 [NASA ADS] [CrossRef] [Google Scholar]
- Oosterhoff, P. T. 1957a, Bull. Astron. Inst. Netherlands, 13, 320 [NASA ADS] [Google Scholar]
- Oosterhoff, P. T. 1957b, Bull. Astron. Inst. Netherlands, 13, 317 [NASA ADS] [Google Scholar]
- Percy, J. R., Molak, A., Lund, H., et al. 2006, PASP, 118, 805 [NASA ADS] [CrossRef] [Google Scholar]
- Petersen, J. O. 1973, A&A, 27, 89 [NASA ADS] [Google Scholar]
- Pietrukowicz, P., Dziembowski, W. A., Mróz, P., et al. 2013, Acta Astron., 63, 379 [Google Scholar]
- Pietrukowicz, P., Udalski, A., Szymański, M. K., et al. 2015, ApJ, 813, L40 [NASA ADS] [CrossRef] [Google Scholar]
- Poleski, R. 2013, ApJ, 778, 147 [NASA ADS] [CrossRef] [Google Scholar]
- Poretti, E., Baglin, A., & Weiss, W. W. 2014, ApJ, 795, L36 [NASA ADS] [CrossRef] [Google Scholar]
- Prantzos, N., Abia, C., Limongi, M., Chieffi, A., & Cristallo, S. 2018, MNRAS, 476, 3432 [NASA ADS] [CrossRef] [Google Scholar]
- Prudil, Z., Smolec, R., Skarka, M., & Netzel, H. 2017, MNRAS, 465, 4074 [NASA ADS] [CrossRef] [Google Scholar]
- Reid, M. J. 1993, ARA&A, 31, 345 [NASA ADS] [CrossRef] [Google Scholar]
- Sandage, A., & Tammann, G. A. 2006, ARA&A, 44, 93 [NASA ADS] [CrossRef] [Google Scholar]
- Sanders, N. E., Caldwell, N., McDowell, J., & Harding, P. 2012, ApJ, 758, 133 [Google Scholar]
- Savanov, I. S. 2014, Astron. Rep., 58, 478 [NASA ADS] [CrossRef] [Google Scholar]
- Shappee, B. J., Prieto, J. L., Grupe, D., et al. 2014, ApJ, 788, 48 [NASA ADS] [CrossRef] [Google Scholar]
- Smolec, R., & Moskalik, P. 2010, A&A, 524, A40 [NASA ADS] [CrossRef] [EDP Sciences] [Google Scholar]
- Smolec, R., Prudil, Z., Skarka, M., & Bakowska, K. 2016, MNRAS, 461, 2934 [NASA ADS] [CrossRef] [Google Scholar]
- Soszyński, I., Poleski, R., Udalski, A., et al. 2008, Acta Astron., 58, 163 [NASA ADS] [Google Scholar]
- Soszyński, I., Poleski, R., Udalski, A., et al. 2010, Acta Astron., 60, 17 [NASA ADS] [Google Scholar]
- Soszyński, I., Udalski, A., Pietrukowicz, P., et al. 2011, Acta Astron., 61, 285 [NASA ADS] [Google Scholar]
- Soszyński, I., Udalski, A., Szymański, M. K., et al. 2015, Acta Astron., 65, 329 [NASA ADS] [Google Scholar]
- Swope, H. H., & Shapley, H. 1937, Ann. Harvard College Obs., 105, 499 [NASA ADS] [Google Scholar]
- Sziládi, K., Vinkó, J., Poretti, E., Szabados, L., & Kun, M. 2007, A&A, 473, 579 [NASA ADS] [CrossRef] [EDP Sciences] [Google Scholar]
- Taylor, M. B. 2005, ASP Conf. Ser., 347, 29 [Google Scholar]
- Torrealba, G., Catelan, M., Drake, A. J., et al. 2015, MNRAS, 446, 2251 [NASA ADS] [CrossRef] [Google Scholar]
- Udalski, A., Szymański, M. K., & Szymański, G. 2015, Acta Astron., 65, 1 [NASA ADS] [Google Scholar]
- Urbaneja, M. A., Herrero, A., Bresolin, F., et al. 2005, ApJ, 622, 862 [NASA ADS] [CrossRef] [Google Scholar]
- VanderPlas, J., Connolly, A. J., Ivezic, Z., & Gray, A. 2012, Proceedings of Conference on Intelligent Data Understanding (CIDU), 47 [Google Scholar]
- Watson, C. L., Henden, A. A., & Price, A. 2006, Society for Astronomical Sciences Annual Symposium, 25, 47 [Google Scholar]
- Wenger, M., Ochsenbein, F., Egret, D., et al. 2000, A&AS, 143, 9 [NASA ADS] [CrossRef] [EDP Sciences] [Google Scholar]
- Wils, P., & Greaves, J. 2004, IBVS, 5512, [Google Scholar]
- Wils, P., Henden, A. A., Kleidis, S., Schmidt, E. G., & Welch, D. L. 2010, MNRAS, 402, 1156 [NASA ADS] [CrossRef] [Google Scholar]
- Zurita, A., & Bresolin, F. 2012, MNRAS, 427, 1463 [NASA ADS] [CrossRef] [Google Scholar]
All Tables
Variability properties of double-mode Cepheids in common in the McMaster database (left panel) and Gaia DR2 (right panel).
Galactocentric distances derived from Gaia DR2 parallaxes (Gaia Collaboration 2018), Gaia DR2 parallaxes combined with a geometrical prior (Bailer-Jones et al. 2018), or period-Wesenheit relations in the near-infrared (Inno et al. 2013; Genovali et al. 2014).
Influence of the adopted distance to the Galactic center on the slope and intercept of the metallicity gradient.
All Figures
|
Fig. 1. Example light curves and power spectra of selected variables from our analysis of the Gaia DR2 F/1O double-mode Cepheid sample. For each of the four stars, the left-hand panels show the Gaia G-band light curves folded with the periodicity found by our analysis. For three stars, the smaller panels show their original (top) and whitened (bottom) power spectra in the frequency region where the fundamental and first-overtone signals are expected. On the top panels, vertical bars show the identified periodicity of each star. Meanwhile, on the bottom panels, the vertical bars show the location of the secondary periodicity given by the Gaia DR2 variability catalog (gaiadr2.vari_cepheid Clementini et al. 2018). For the last star, the right-hand panel shows light curves available for the variable in the literature (Hackstein et al. 2015), which reaffirm our analysis of the Gaia light curves. |
| In the text | |
|
Fig. 2. Petersen diagrams (see text for explanations). Left panel: the entire Gaia DR2 sample of F/1O Cepheids (including those located in the Magellanic Clouds, 162 stars in total) is displayed over OGLE data for different classes of Cepheids pulsating in different modes. Previously known F/1O Cepheids in the Milky Way are shown as black crosses. Right panel: the bona fide Gaia DR2 sample of F/1O Cepheids (three stars) is displayed over OGLE data for different classes of Cepheids pulsating in different modes. Previously known F/1O Cepheids in the Milky Way are shown as black crosses. |
| In the text | |
|
Fig. 3. Comparison of the heliocentric distance computed by inverting the Gaia DR2 parallax to the heliocentric distance derived by Bailer-Jones et al. (2018) using a geometrical distance prior. |
| In the text | |
|
Fig. 4. Comparison of the Galactocentric distances computed using Gaia DR2 parallaxes only, or combining them with a geometrical distance prior (Bailer-Jones et al. 2018). Galactocentric distances derived from near-infrared photometry (Inno et al. 2013; Genovali et al. 2014) and their associated error bars are shown in red. For comparison purposes, all the distances have been computed assuming that the Sun is located at 7.94 kpc from the Galactic center (Matsunaga et al. 2013). |
| In the text | |
|
Fig. 5. Spatial distribution of the F/1O Cepheids in the Milky Way. The currently known F/1O Cepheids are shown in blue, and in yellow and green for the bulge and disk Cepheids in the OGLE sample of Soszyński et al. (2011) and Pietrukowicz et al. (2013), respectively. The new F/1O Cepheids in Gaia DR2 are shown in red. |
| In the text | |
|
Fig. 6. Metallicity gradient in the disk where distances and metallicities are the nominal values derived from the Gaia DR2 parallaxes and the Kovtyukh et al. (2016) relation, respectively. The color coding is the same as in Fig. 5. The slope and the intercept of the gradient have been computed using a bootstrap method (see Sect. 5.3). |
| In the text | |
|
Fig. 7. Comparison of the slopes of the present-day [Fe/H] gradient derived from Cepheids in different studies (Lemasle et al. 2007, 2008; Luck et al. 2011; Luck & Lambert 2011; Genovali et al. 2014). Slopes and error bars are shown in black while the red line and red area represent the result of the current study using 24 F/1O Cepheids (Bootstrap method, Rg⊙ = 7.94 kpc). |
| In the text | |
|
Fig. 8. Metallicity gradient in the disk where distances and metallicities are the nominal values derived from the Gaia DR2 parallaxes and the Kovtyukh et al. (2016) relation, respectively. The slope and the intercept of the gradient have been computed using a total least square method (see Sect. 5.4). The ellipses trace the 1-σ and 2-σ likelihood contours. |
| In the text | |
Current usage metrics show cumulative count of Article Views (full-text article views including HTML views, PDF and ePub downloads, according to the available data) and Abstracts Views on Vision4Press platform.
Data correspond to usage on the plateform after 2015. The current usage metrics is available 48-96 hours after online publication and is updated daily on week days.
Initial download of the metrics may take a while.