Fig. 1.
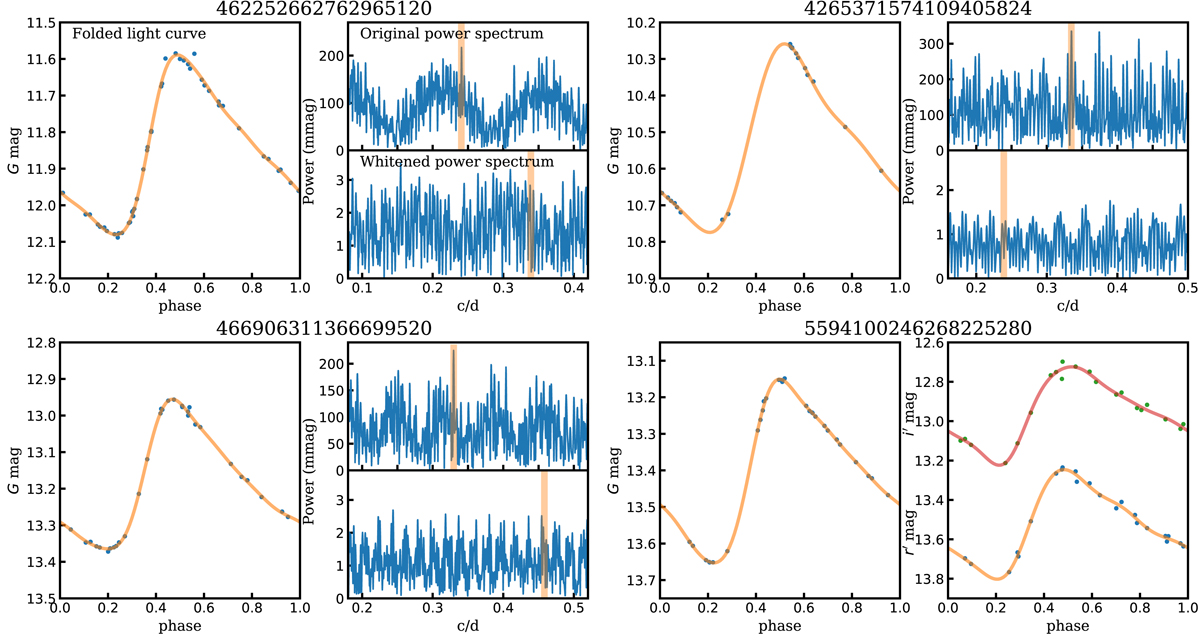
Example light curves and power spectra of selected variables from our analysis of the Gaia DR2 F/1O double-mode Cepheid sample. For each of the four stars, the left-hand panels show the Gaia G-band light curves folded with the periodicity found by our analysis. For three stars, the smaller panels show their original (top) and whitened (bottom) power spectra in the frequency region where the fundamental and first-overtone signals are expected. On the top panels, vertical bars show the identified periodicity of each star. Meanwhile, on the bottom panels, the vertical bars show the location of the secondary periodicity given by the Gaia DR2 variability catalog (gaiadr2.vari_cepheid Clementini et al. 2018). For the last star, the right-hand panel shows light curves available for the variable in the literature (Hackstein et al. 2015), which reaffirm our analysis of the Gaia light curves.
Current usage metrics show cumulative count of Article Views (full-text article views including HTML views, PDF and ePub downloads, according to the available data) and Abstracts Views on Vision4Press platform.
Data correspond to usage on the plateform after 2015. The current usage metrics is available 48-96 hours after online publication and is updated daily on week days.
Initial download of the metrics may take a while.