Fig. 7
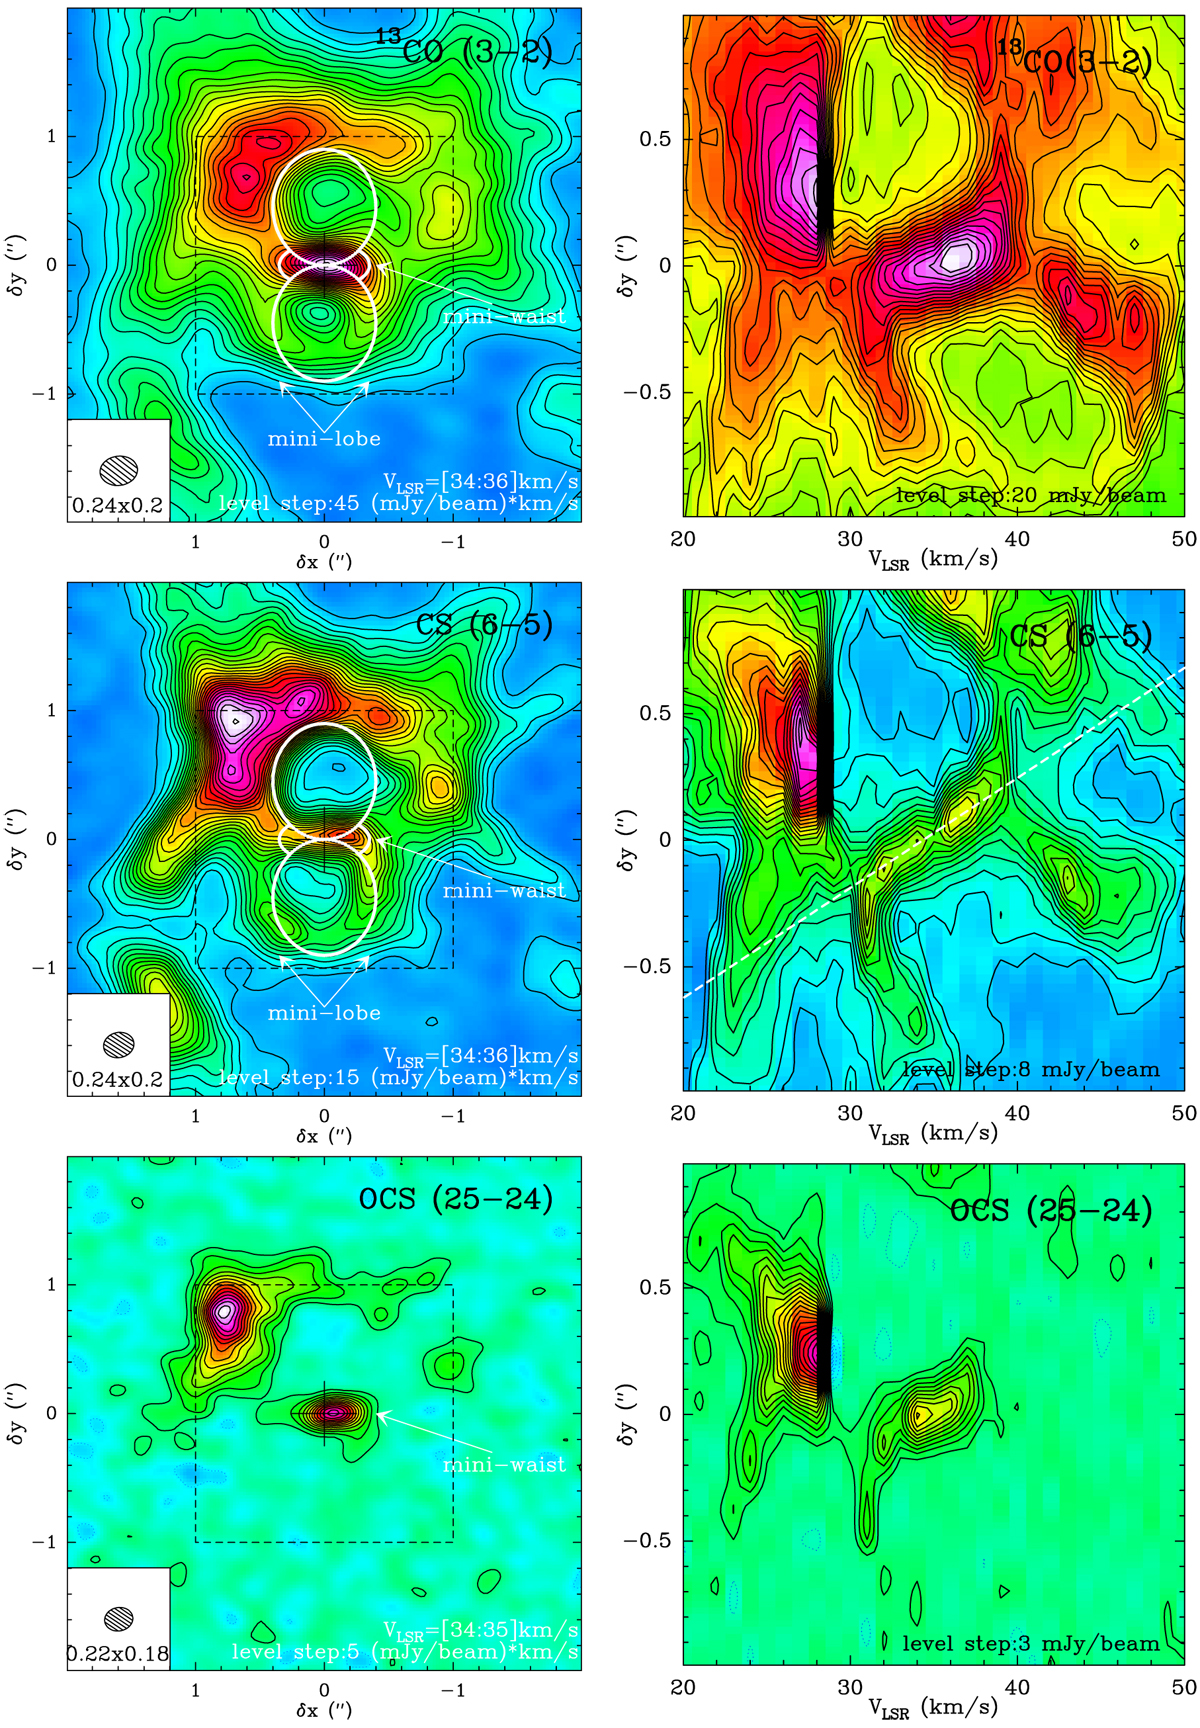
Left: zero-order moment maps of 13CO (J = 3–2), CS (J = 6–5), and OCS (J = 25–24) integrated over the central channels near VLSR = 35 km s−1, showing the ~1′′ × 2′′ mini-hg centered at clump S (schematically depicted atop). The OCS emission is largely restricted to the equatorial waist, of both the mini- and large-hourglass. The dashed squares indicate the smaller FoV used in the axial PV diagrams to the right. Right: PV diagrams along PA = 21°. The linear velocity gradient along the mini-waist is indicated with a dashed line.
Current usage metrics show cumulative count of Article Views (full-text article views including HTML views, PDF and ePub downloads, according to the available data) and Abstracts Views on Vision4Press platform.
Data correspond to usage on the plateform after 2015. The current usage metrics is available 48-96 hours after online publication and is updated daily on week days.
Initial download of the metrics may take a while.