Fig. 4
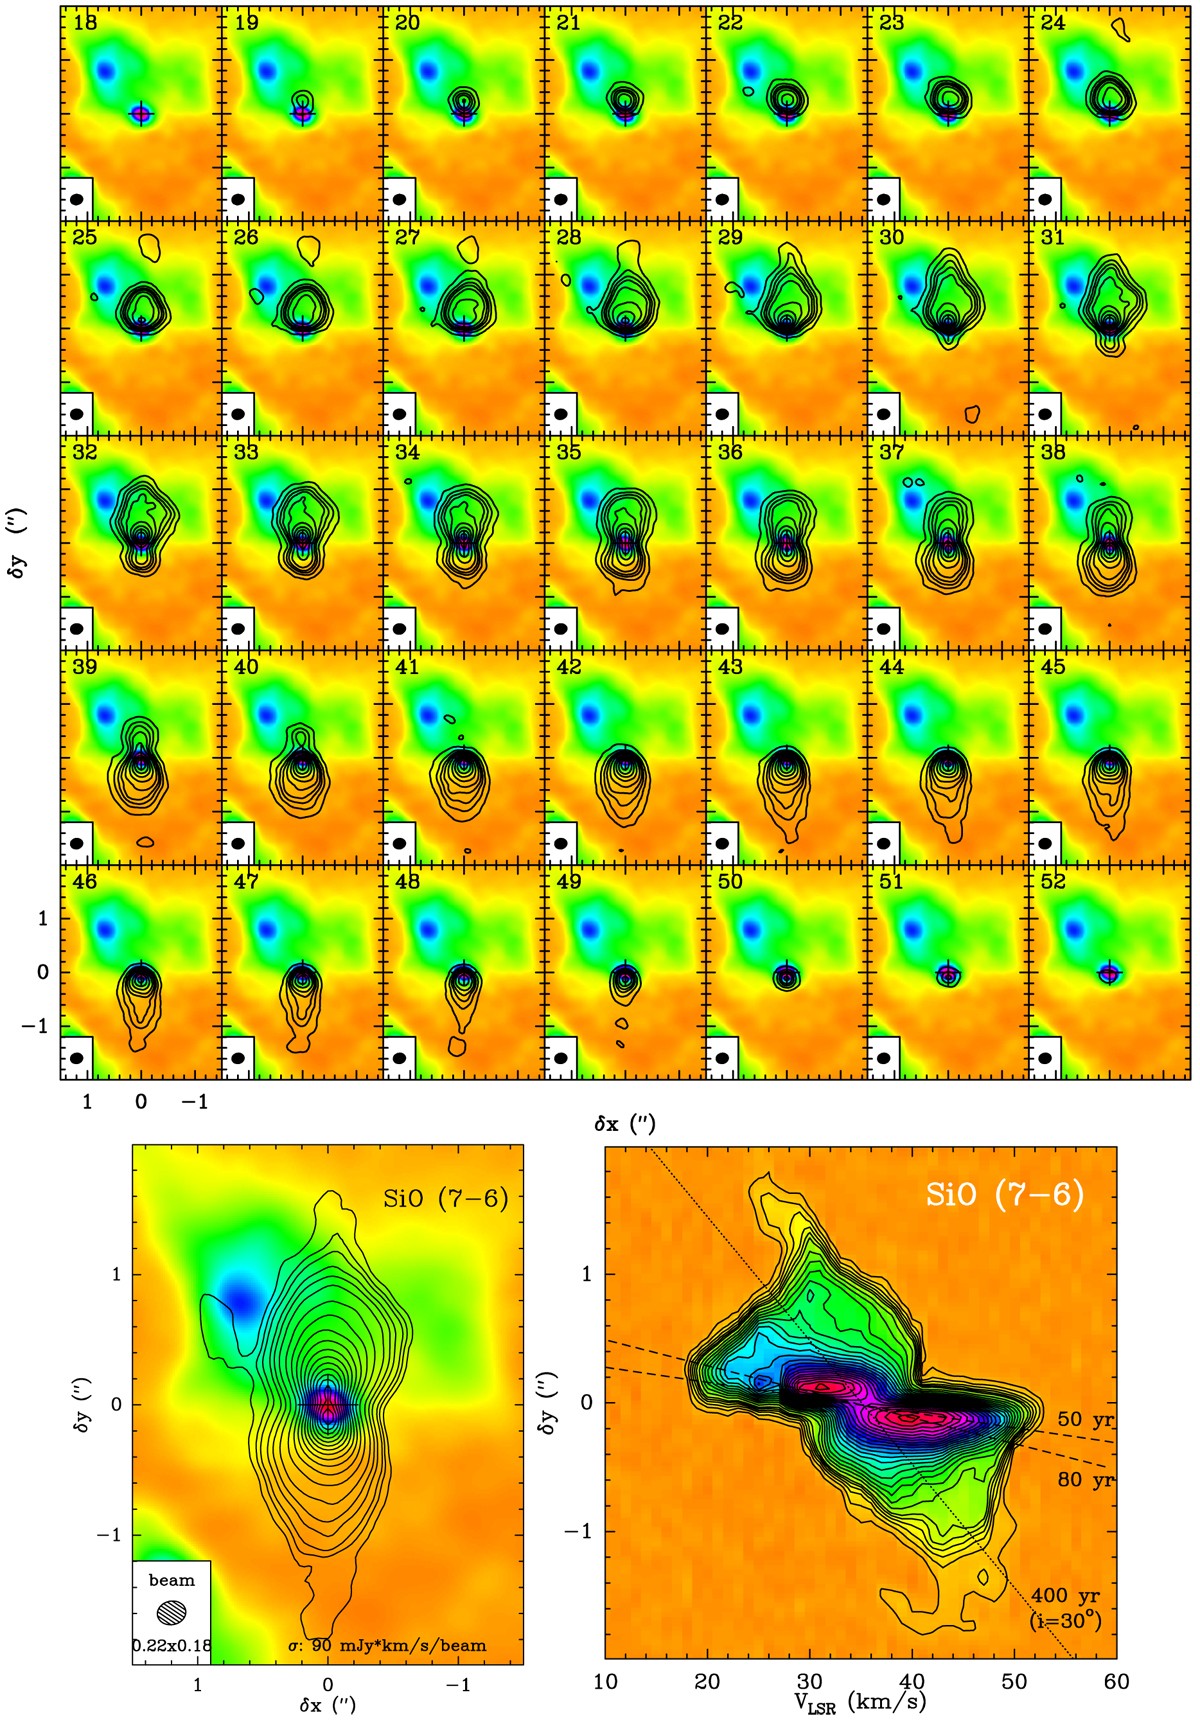
SiO (J = 7–6) compact bipolar outflow emerging from clump S. Top: velocity-channel maps rotated clockwise by PA = 21°; contours are 1σ, 2σ, 3σ, 5σ, 7σ, 10σ... by 5σ (σ = 10 mJy/beam). The rms of the line-free dv = 1 km s−1-channel maps is 2.7 mJy/beam. The background image is the 330 GHz-continuum map. Bottom-left: order-zero moment map over the VLSR = [18–53] km s−1 velocity range; contours as in top panel but with σ = 90 mJy/beam km s−1. Bottom-right: axial position-velocity diagrams along PA = 21°; contours are 1σ to 6σ by 1σ, and from 8σ... by 2σ (σ = 9 mJy/beam). The lines represent different velocity gradients implying different kinematic ages at various regions of the SiO-outflow (dashed-black: the SiO-knots, dotted-black: flame-shaped lobes – average).
Current usage metrics show cumulative count of Article Views (full-text article views including HTML views, PDF and ePub downloads, according to the available data) and Abstracts Views on Vision4Press platform.
Data correspond to usage on the plateform after 2015. The current usage metrics is available 48-96 hours after online publication and is updated daily on week days.
Initial download of the metrics may take a while.