Fig. 3
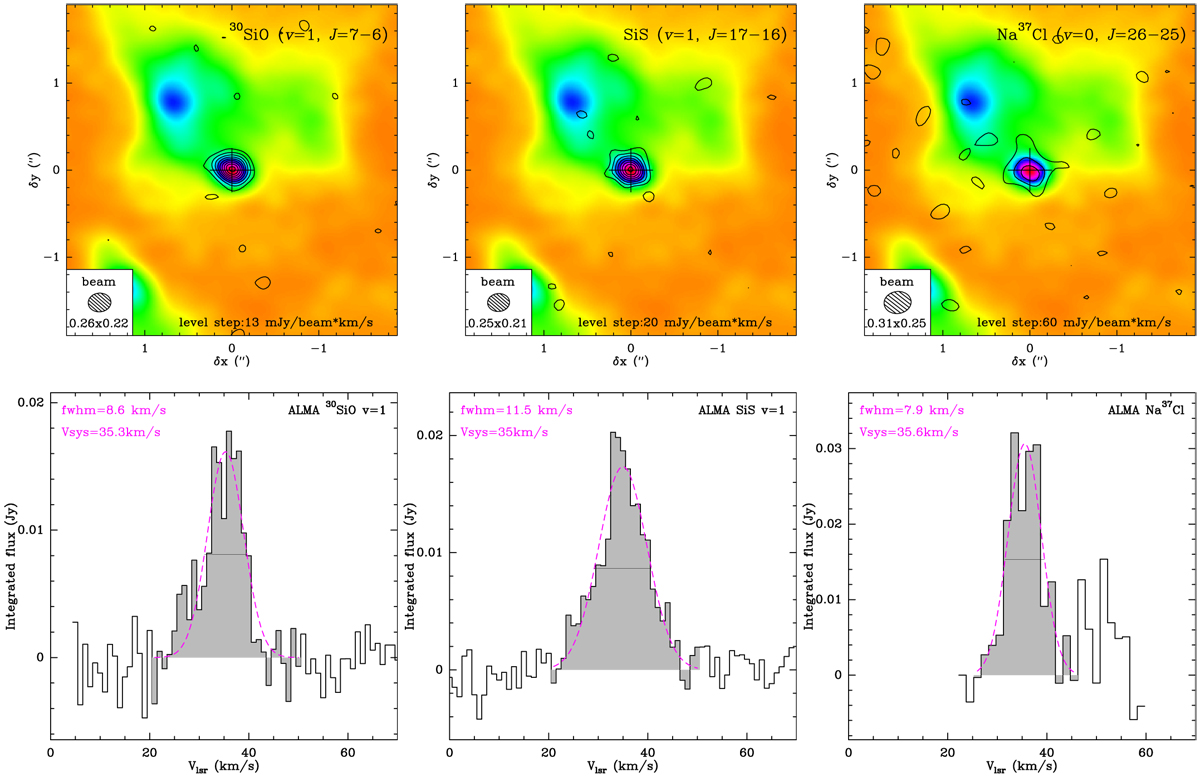
Integrated intensity maps (contours) on top of the continuum at 330 GHz (color; rotated clockwise by PA = 21°, top) and integrated 1d-spectra (bottom) of the three molecular transitions with compact emission from the close surroundings of QX Pup (clump S). The coordinates of clump S are RA = 07h42m16. s915 and Dec = −14°42′50.′′06 (J2000). The position of clump S has been adopted as the origin of positional offsets in these and all subsequent figures illustrating image data. Gaussian fits to the line profiles (dashed lines) are shown together with the line centroids and full width at half maximum (bottom).
Current usage metrics show cumulative count of Article Views (full-text article views including HTML views, PDF and ePub downloads, according to the available data) and Abstracts Views on Vision4Press platform.
Data correspond to usage on the plateform after 2015. The current usage metrics is available 48-96 hours after online publication and is updated daily on week days.
Initial download of the metrics may take a while.