Fig. 14
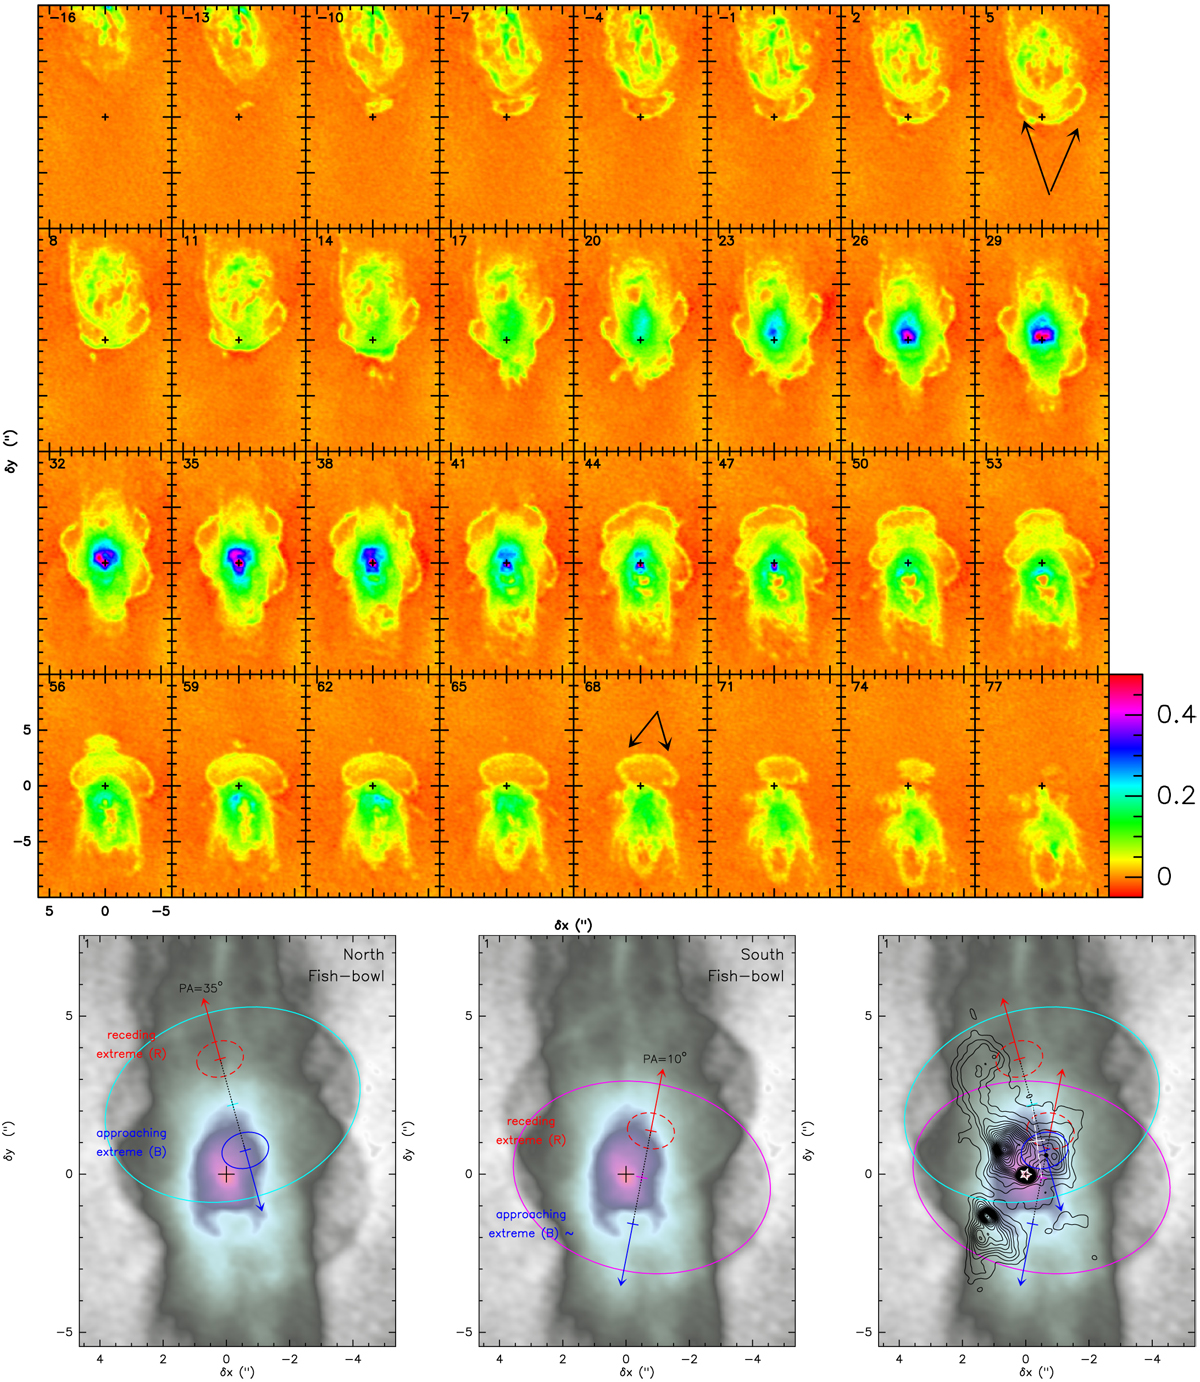
Top: velocity-channel maps of 12CO (3–2) in the velocity range where two faint, elongated bubble-like features (dubbed the fish bowls) are discovered in the central regions of OH 231.8 (Sect. 4.5). Bottom: zero-order moment maps of 12CO (J = 3–2) integrated over the VLSR = [−13:+77] km s−1 range. The big ellipses represent the projection on the plane of the sky of the outer surface of the ellipsoids that represent the north (left) and south (middle) fish bowls. The small red and blue ellipses represent schematically the receeding and approaching vertex of the ellipsoids projected in the plane of the sky. In the right panel the continuum emission map is atop the 12CO (3–2) integrated map. The dashed line connects the centroids of the north and south fish bowls.
Current usage metrics show cumulative count of Article Views (full-text article views including HTML views, PDF and ePub downloads, according to the available data) and Abstracts Views on Vision4Press platform.
Data correspond to usage on the plateform after 2015. The current usage metrics is available 48-96 hours after online publication and is updated daily on week days.
Initial download of the metrics may take a while.