Fig. 13
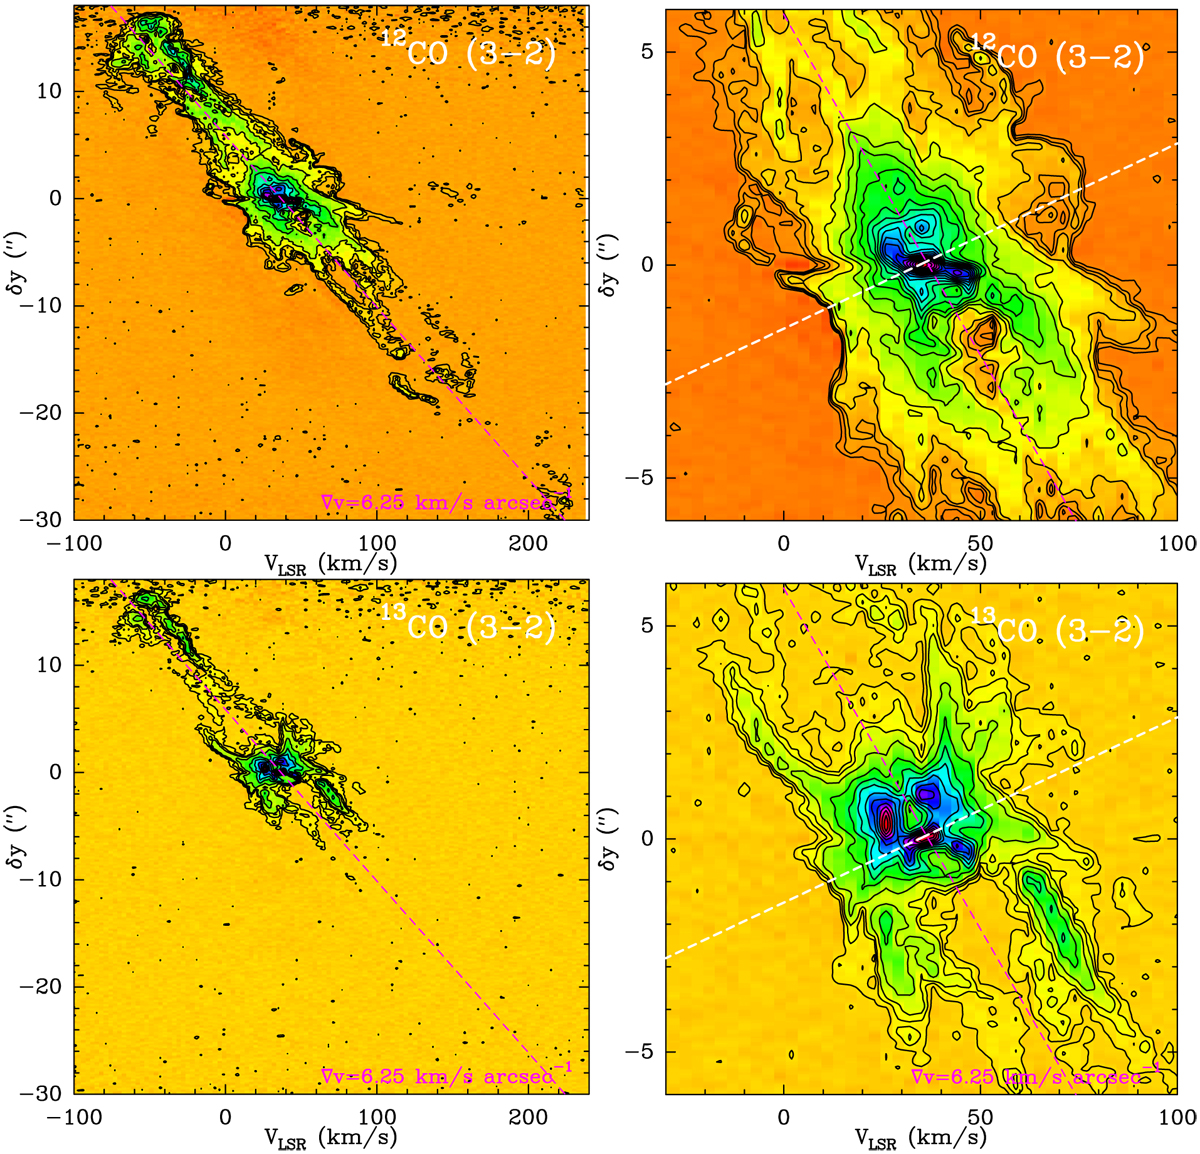
Position-velocity diagram along PA = 21° of 12CO (J = 3–2) (top; HPBW= 0.′′31 × 0.′′24) and 13CO (J = 3–2) (bottom; HPBW = 0.′′33 × 0.′′26). show the fullspatial and VLSR range where CO emission is detected, whereas the right panel offers a closer view of the central regions (i.e. the large-hg). Level spacing is: 13CO) 1σ, 3σ, 5σ, 10σ... by 10σ (σ = 7 and 5 mJy/beam, in the left and right panels, respectively); 12CO) 1σ, 3σ, 5σ, 10σ... by 10σ (σ = 6 and 4 mJy/beam, in the left and right panels, respectively). The dashed lines indicate the overall velocity gradient along the symmetry axis of the large-scale outflow (purple) and along the equator of the mini-hg (white).
Current usage metrics show cumulative count of Article Views (full-text article views including HTML views, PDF and ePub downloads, according to the available data) and Abstracts Views on Vision4Press platform.
Data correspond to usage on the plateform after 2015. The current usage metrics is available 48-96 hours after online publication and is updated daily on week days.
Initial download of the metrics may take a while.