Fig. 11
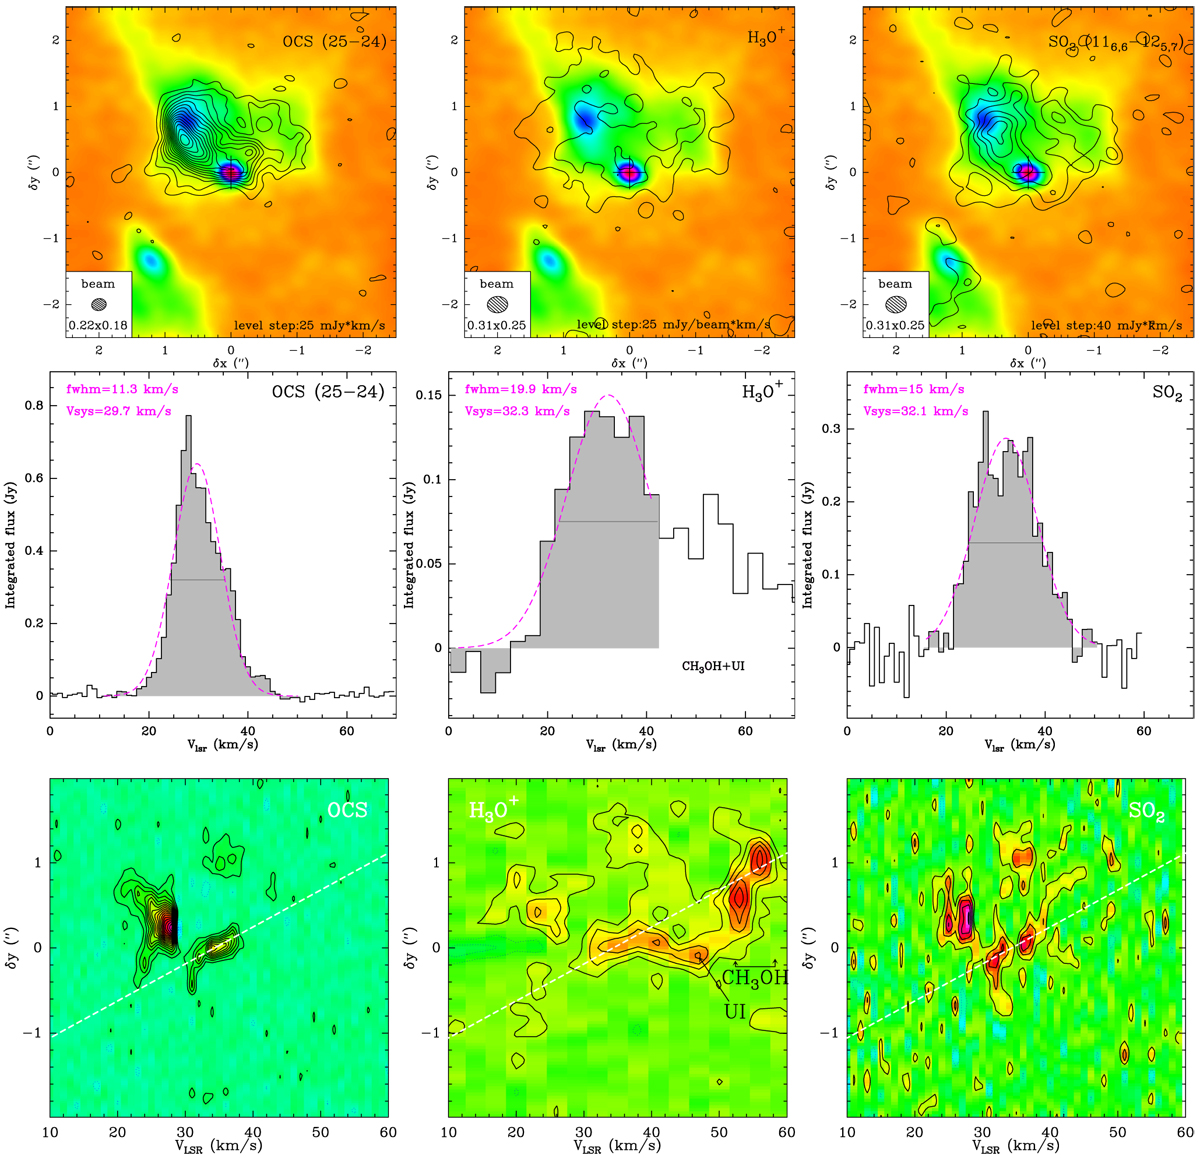
Integrated intensity maps (top), integrated 1d-spectral profiles (middle), and axial PV diagrams (bottom) of molecular transitions whose emission is largely restricted to the equatorial waist (Sect. 4.4.1). The integrated intensity maps are superimposed to the 330 GHz-continuum map. The velocity range of the integrated intensity maps of OCS and SO2 is VLSR = [18:42] km s−1, and for H3O+ is VLSR = [14:50] km s−1. Level step in PV diagrams is 3.5 mJy/beam (OCS), 1.5 mJy/beam (H3O+), and 6 mJy/beam (SO2).
Current usage metrics show cumulative count of Article Views (full-text article views including HTML views, PDF and ePub downloads, according to the available data) and Abstracts Views on Vision4Press platform.
Data correspond to usage on the plateform after 2015. The current usage metrics is available 48-96 hours after online publication and is updated daily on week days.
Initial download of the metrics may take a while.