Fig. 1
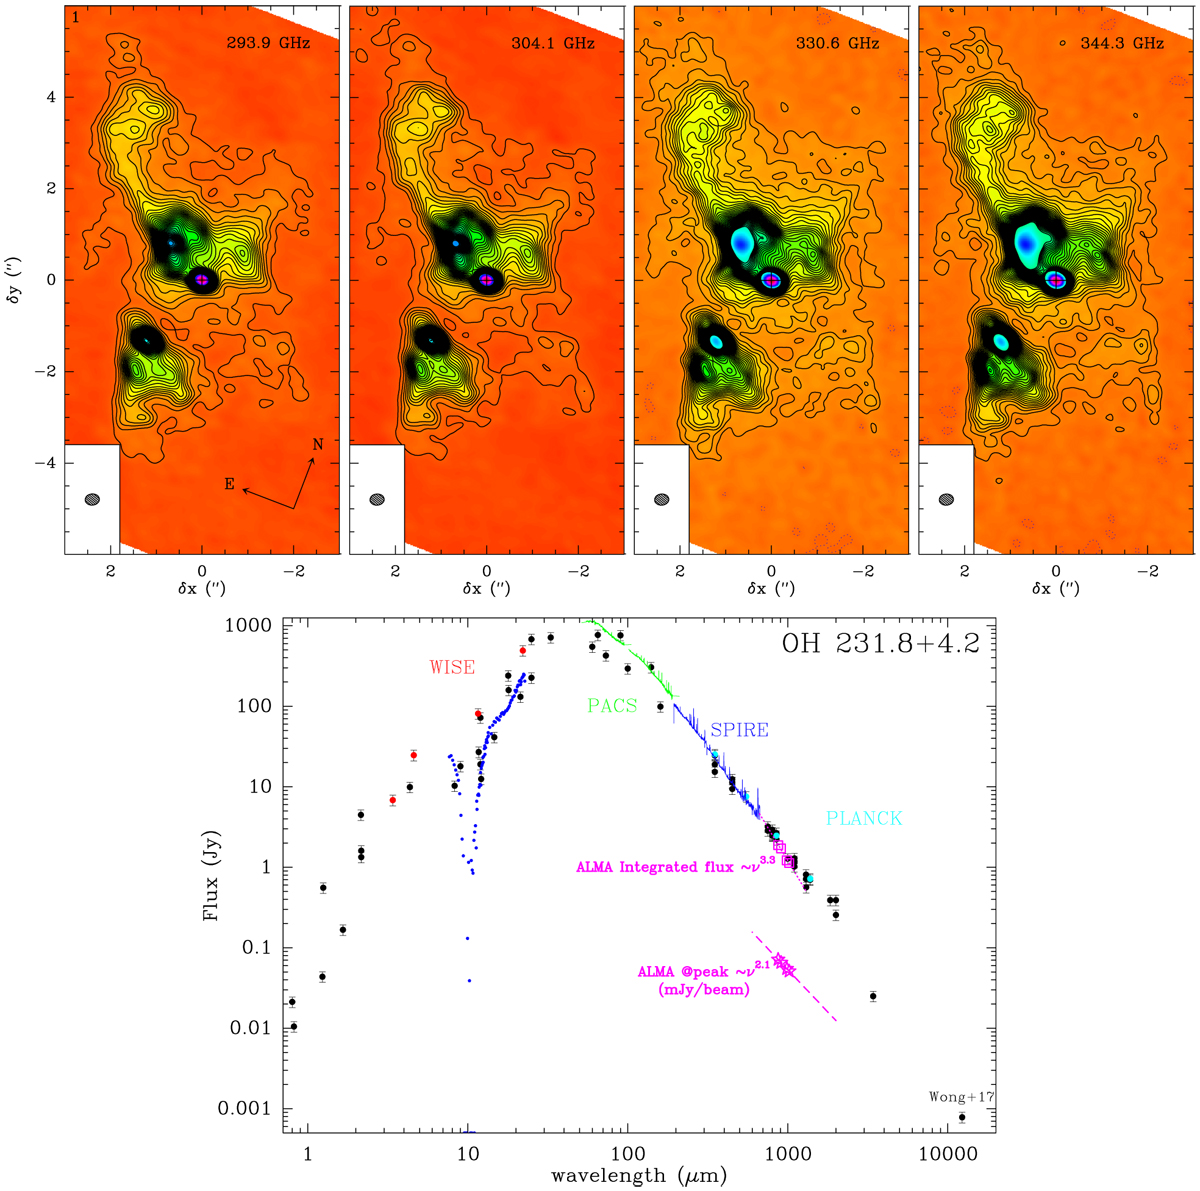
Top: ALMA continuum emission maps of OH 231.8+4.2 at 293, 304, 330, and 344 GHz rotated clockwise by 21° so the symmetry axis is vertical. Countour level spacing is 0.8 mJy/beam. The clean beam (HPBW = 0.′′31 × 0.′′25, PA = −84.5°) is plotted at the bottom-left corner of each panel. The compact region at the center (offset 0′′,0′′) where the continuum emission peaks is referred to as clump S and indicates the location of the AGB star QX Pup (Sect. 3). The center of the maps has equatorial coordinates α(J2000) = 07h42″16. s915, δ(J2000) = −14°42′50.′′06. Bottom: spectral energy distribution (SED) of OH 231.8. Pink symbols are ALMA continuum measurements from this work, as given in Table 2 (squares = integrated flux; stars= peak-flux surface density at clump S) and the dotted and dashed lines are ∝ ν3.3 and ∝ ν2.1 fits to these ALMA data points, respectively. The rest of the continuum fluxes are from the literature, mainly from the compilation by Sánchez Contreras et al. (1998), but also including PACS and SPIRE spectroscopy (from the THROES catalogue; Ramos-Medina et al. 2018), 2MASS, MSX, WISE, and PLANK photometry (from their respective mission archives), one radio-continuum datapoint from Wong et al. (2018), and mid-infrared photometry from Jura et al. (2002). Relative errors of 15% (plotted as errorbars) are adopted for all non-ALMA data. Errorbars of the ALMA data (<5–10%) are smaller than the symbols.
Current usage metrics show cumulative count of Article Views (full-text article views including HTML views, PDF and ePub downloads, according to the available data) and Abstracts Views on Vision4Press platform.
Data correspond to usage on the plateform after 2015. The current usage metrics is available 48-96 hours after online publication and is updated daily on week days.
Initial download of the metrics may take a while.