Free Access
Fig. 10.
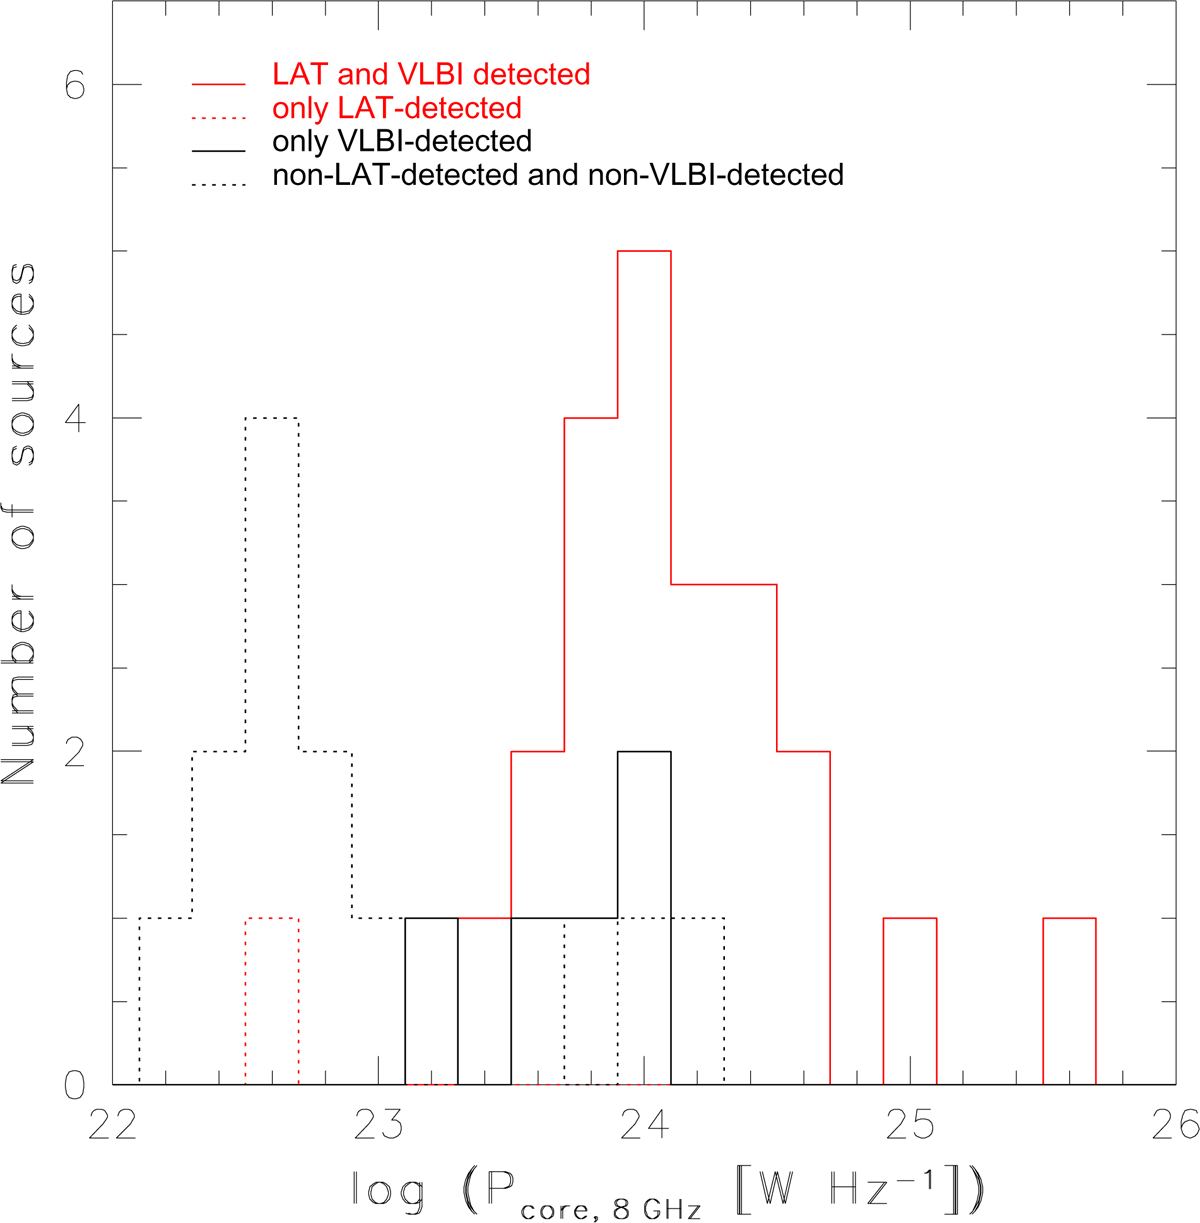
Histogram of the core power at 8 GHz of the sources in our sample. Solid line indicates that the source is detected and short-dash line shows the upper limit. Red lines refer to LAT-detection and black lines refer to VLBI-detection.
Current usage metrics show cumulative count of Article Views (full-text article views including HTML views, PDF and ePub downloads, according to the available data) and Abstracts Views on Vision4Press platform.
Data correspond to usage on the plateform after 2015. The current usage metrics is available 48-96 hours after online publication and is updated daily on week days.
Initial download of the metrics may take a while.