Fig. 1.
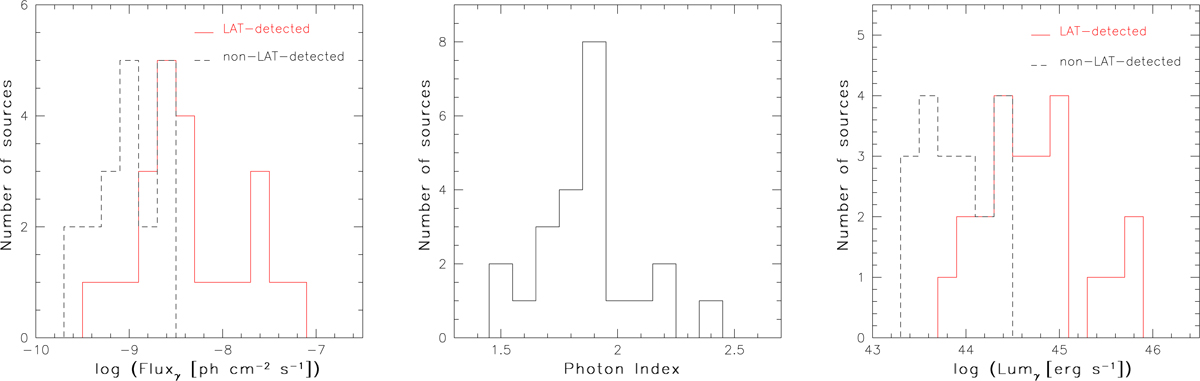
Histogram of the distribution of various quantities obtained by the LAT analysis for the sources in our sample. Short dash line indicates non-LAT-detected sources (TS < 25), for which 2-σ upper limits of the flux are considered; red solid line indicates LAT-detected sources (TS ≥ 25). Left panel: integral fluxes in the 0.1–300 GeV energy range; middle: γ-ray photon index for the 23 LAT-detected sources; right: γ-ray luminosity in the 0.1–300 GeV energy range.
Current usage metrics show cumulative count of Article Views (full-text article views including HTML views, PDF and ePub downloads, according to the available data) and Abstracts Views on Vision4Press platform.
Data correspond to usage on the plateform after 2015. The current usage metrics is available 48-96 hours after online publication and is updated daily on week days.
Initial download of the metrics may take a while.