Free Access
Fig. 5.
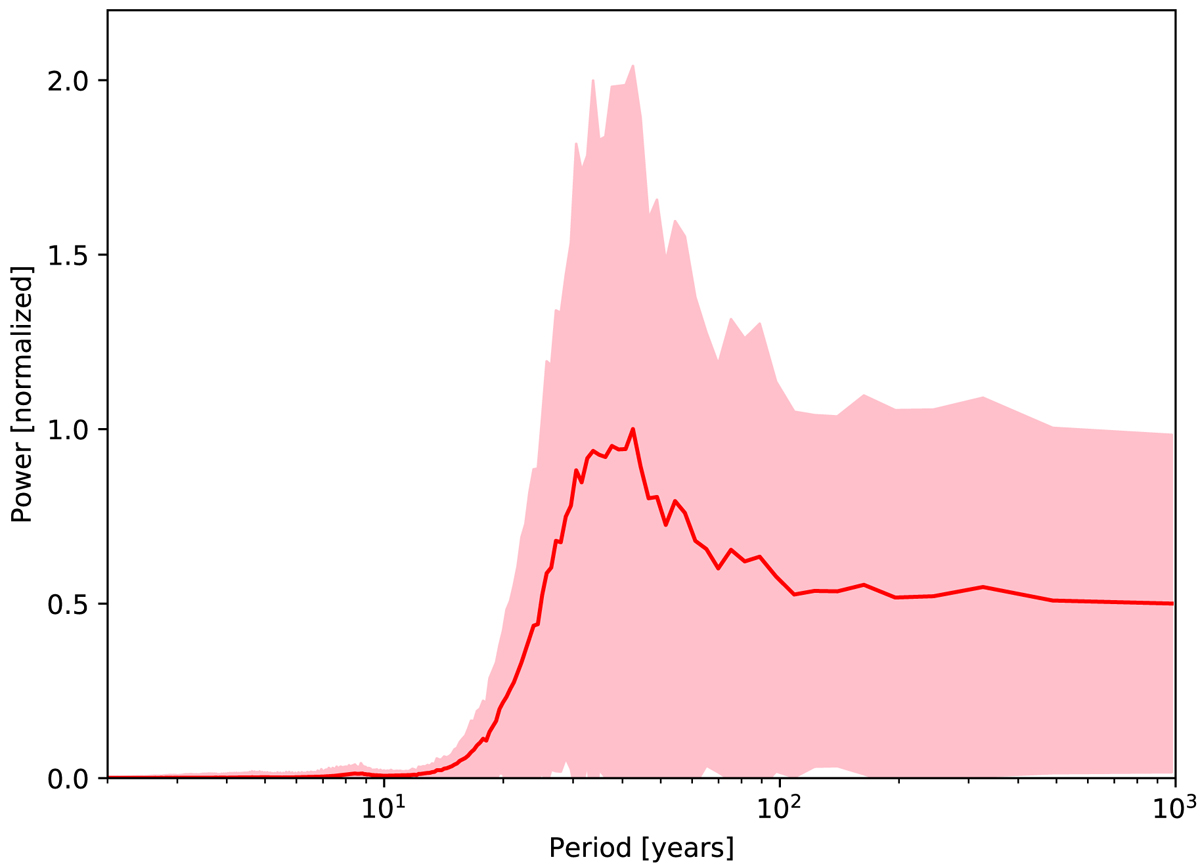
Average power spectrum of the time shift between the hemispheres from 20 realizations of the updated Babcock–Leighton dynamo of 10 000 years length each. The shading indicates ±1 standard deviations.
Current usage metrics show cumulative count of Article Views (full-text article views including HTML views, PDF and ePub downloads, according to the available data) and Abstracts Views on Vision4Press platform.
Data correspond to usage on the plateform after 2015. The current usage metrics is available 48-96 hours after online publication and is updated daily on week days.
Initial download of the metrics may take a while.