Free Access
Fig. 4.
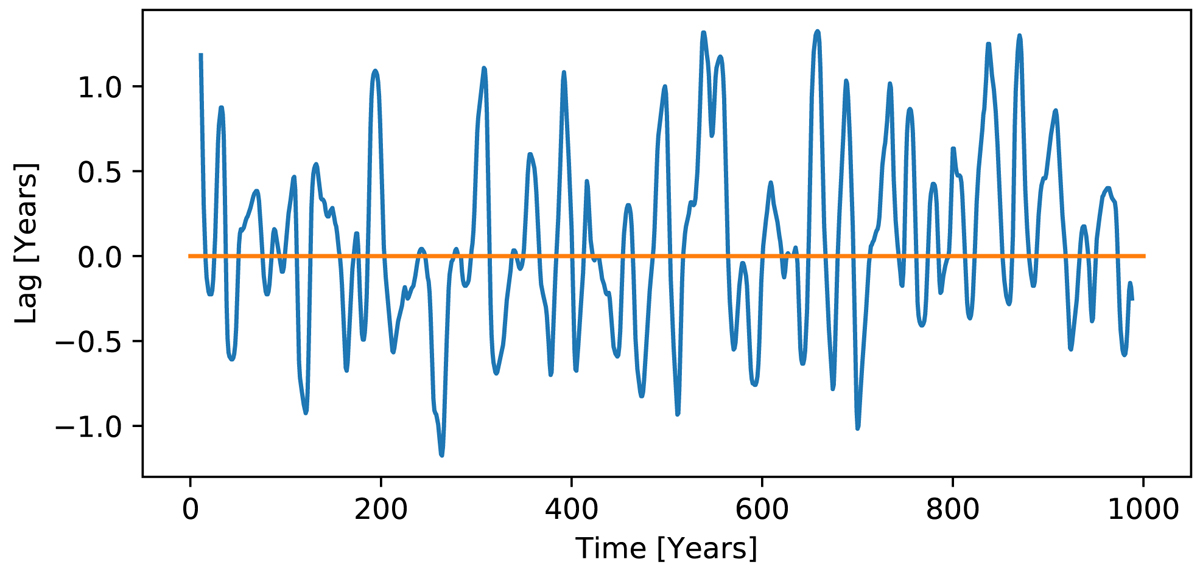
Phase lag (time shift) between the toroidal fluxes in the northern and southern hemispheres for a 1000-yr stretch of a simulation on the basis of the updated Babcock–Leighton model. The lag was determined by using the cross-covariance between segments with a length of 20 years.
Current usage metrics show cumulative count of Article Views (full-text article views including HTML views, PDF and ePub downloads, according to the available data) and Abstracts Views on Vision4Press platform.
Data correspond to usage on the plateform after 2015. The current usage metrics is available 48-96 hours after online publication and is updated daily on week days.
Initial download of the metrics may take a while.