Fig. 1.
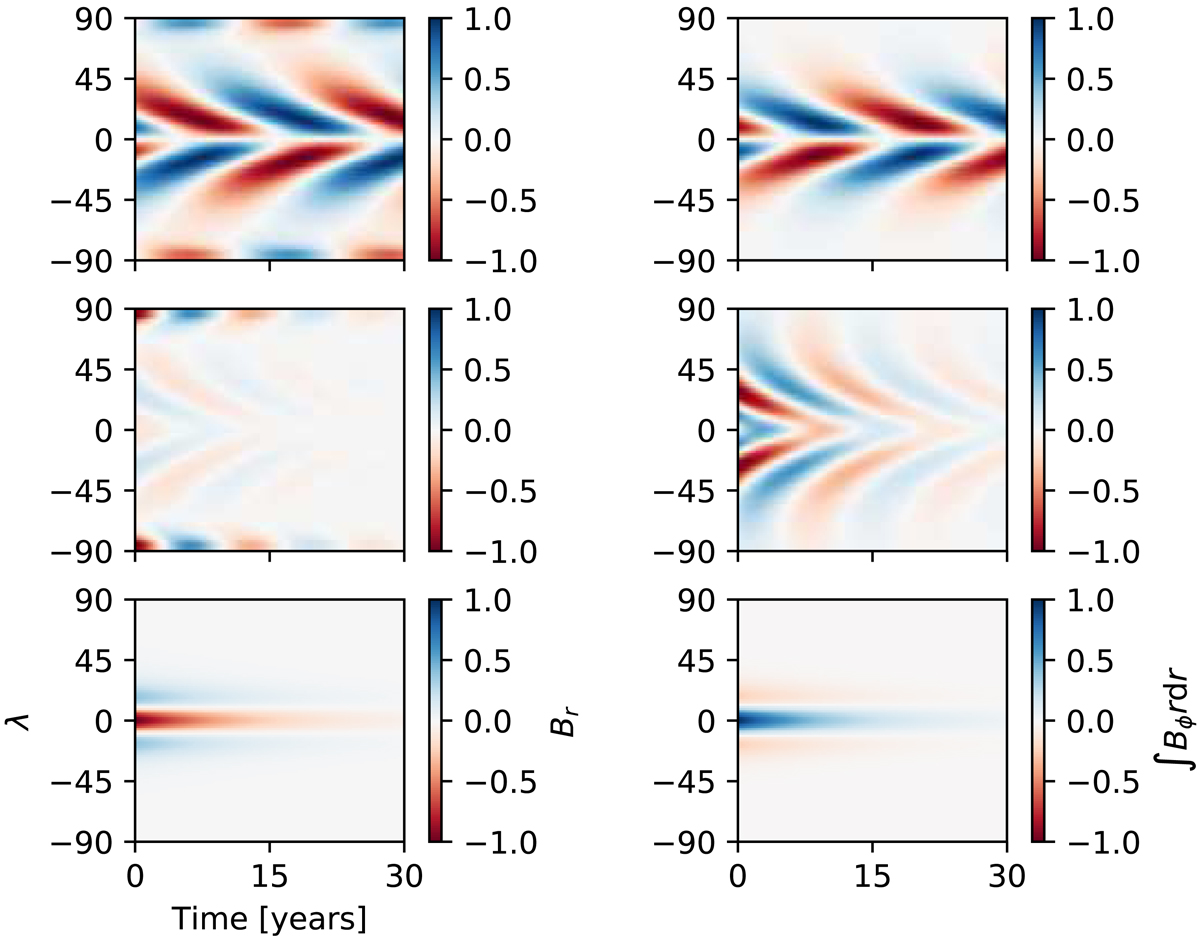
Spatio-temporal structure of the first linear eigenmodes obtained with the updated Babcock–Leighton model (Cameron & Schüssler 2017a). Shown are latitude-time diagrams of the azimuthally averaged radial surface field (left panels) and the radially integrated toroidal flux (right panels). The three modes shown are an excited oscillatory dipolar mode (top panels), a damped oscillatory quadrupolar mode (middle panels) and a damped stationary quadrupolar mode (bottom panels). The quantities are normalised to their individual maxima in all cases.
Current usage metrics show cumulative count of Article Views (full-text article views including HTML views, PDF and ePub downloads, according to the available data) and Abstracts Views on Vision4Press platform.
Data correspond to usage on the plateform after 2015. The current usage metrics is available 48-96 hours after online publication and is updated daily on week days.
Initial download of the metrics may take a while.