Fig. 3
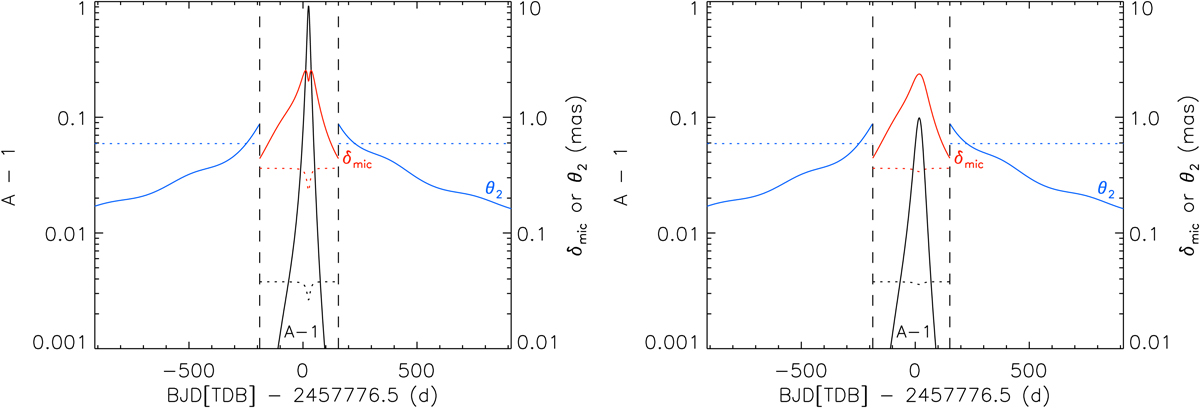
Variation of the magnification above baseline A − 1 (black curve) and the centroid shifts δmic (mas; red curve) and θ2 (mas; blue curve) as a function of time (d) for the two fictitious microlensing events described in Sect. 3.5. The events differ only in that u0 = 0.6 and u0 = 1.6 for the left- and right-hand panels, respectively. The vertical dashed lines in each panel indicate when an event switches between unresolved and partially-resolved microlensing based on the median Gaia spatial resolution of ~103 mas. The dotted curves indicate the photometric (G-band) and astrometric (along-scan) precisions for a single observation with black, red and blue colours corresponding to A − 1, δmic and θ2, respectively.
Current usage metrics show cumulative count of Article Views (full-text article views including HTML views, PDF and ePub downloads, according to the available data) and Abstracts Views on Vision4Press platform.
Data correspond to usage on the plateform after 2015. The current usage metrics is available 48-96 hours after online publication and is updated daily on week days.
Initial download of the metrics may take a while.