Fig. 2
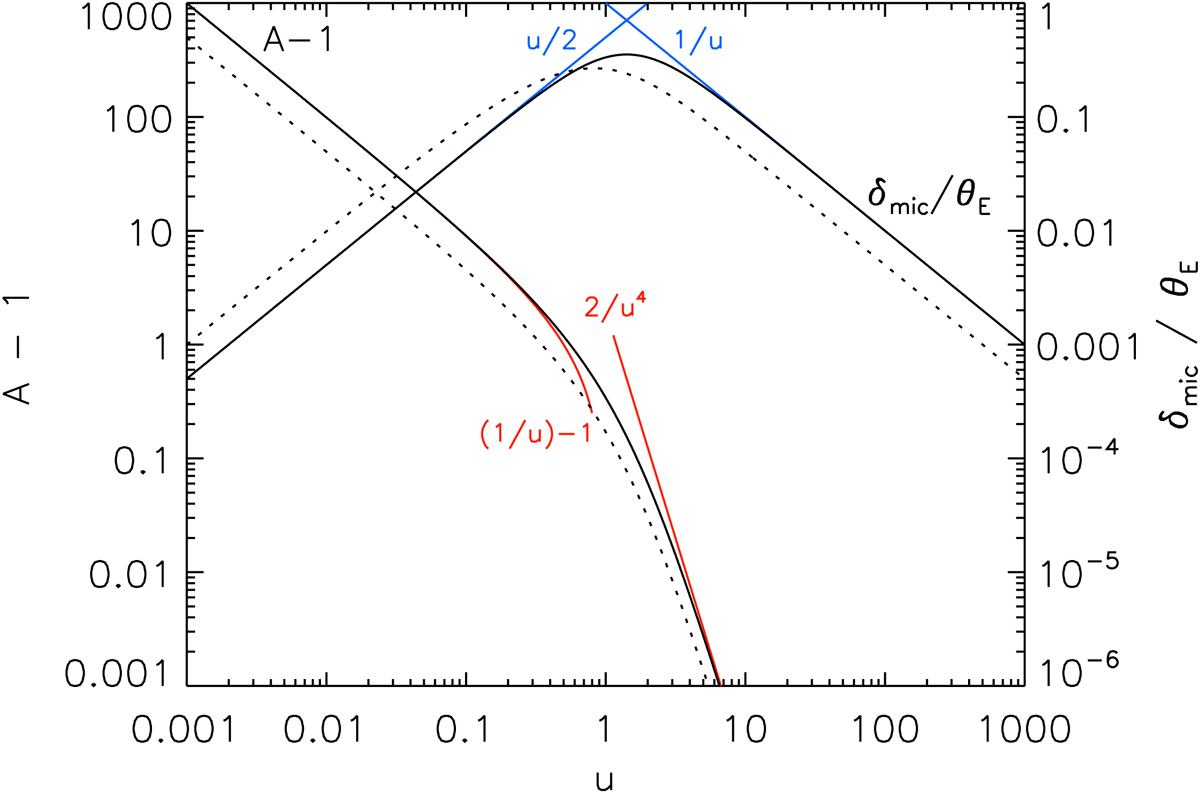
Variation of the magnification above baseline A − 1 and the normalised centroid shift δmic/θE during a microlensing event as a function of the normalised source-lens separation u. Continuous and dotted black curves correspond to the cases of a dark lens (fL = 0) and a luminous lens with fL/ fS = 1, respectively. The asymptotic behaviour of the photometric and astrometric signals for the specific case of a dark lens is plotted using red and blue curves, respectively, and these asymptotic curves are labelled with their functional form.
Current usage metrics show cumulative count of Article Views (full-text article views including HTML views, PDF and ePub downloads, according to the available data) and Abstracts Views on Vision4Press platform.
Data correspond to usage on the plateform after 2015. The current usage metrics is available 48-96 hours after online publication and is updated daily on week days.
Initial download of the metrics may take a while.