Fig. 10
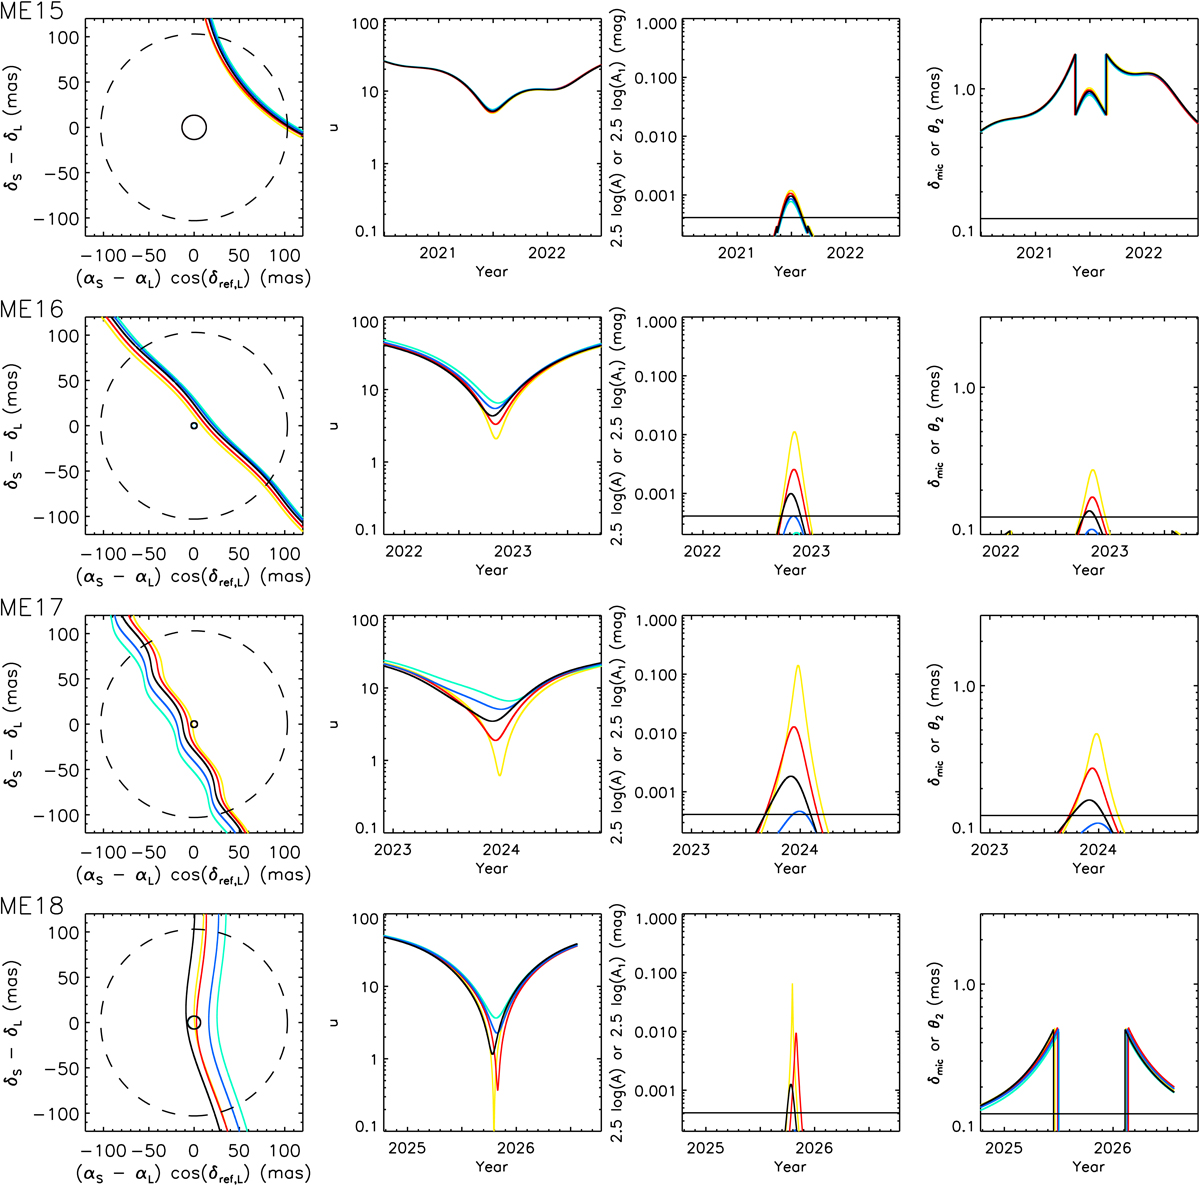
Photometric microlensing events ME15-ME18. In all panels, five curves are plotted with the colours yellow, red, black, blue, and cyan. Each curve corresponds to the 2.3, 15.9, 50, 84.1, and 97.7 percentiles, respectively, of the results of the Monte Carlo simulations performed in Sect. 5.2 after they have been ordered by increasing u0. The yellow and cyan curves are plotted first, followed by the red and blue curves, and finally the black curve, which is why the black curve is the most visible when the individual curves are hard to distinguish. Left-hand panels: path of the source star relative to the lens star. The Einstein ring is shown as a circle of radius θE centred on the lens position (also plotted five times with five different colours). The resolution of Gaia is indicated as a circle of radius 103 mas centred on the lens position (dashed curve). Middle left-hand panels: time-evolution of the normalised source-lens separation u. Middle right-hand panels: time-evolution of the photometric signals 2.5 log(A) (mag; unresolved regime) and 2.5 log(A1) (mag; partially-resolved regime). The horizontal black line indicates the photometric precision limit of 0.4 mmag from Sect. 4.2.5. Right-hand panels: time-evolution of the astrometric signals δmic (mas; unresolved regime) and θ2 (mas; partially-resolved regime). The horizontal black line indicates the astrometric precision limit of 0.131 mas from Sect. 4.2.5.
Current usage metrics show cumulative count of Article Views (full-text article views including HTML views, PDF and ePub downloads, according to the available data) and Abstracts Views on Vision4Press platform.
Data correspond to usage on the plateform after 2015. The current usage metrics is available 48-96 hours after online publication and is updated daily on week days.
Initial download of the metrics may take a while.