Fig. 6.
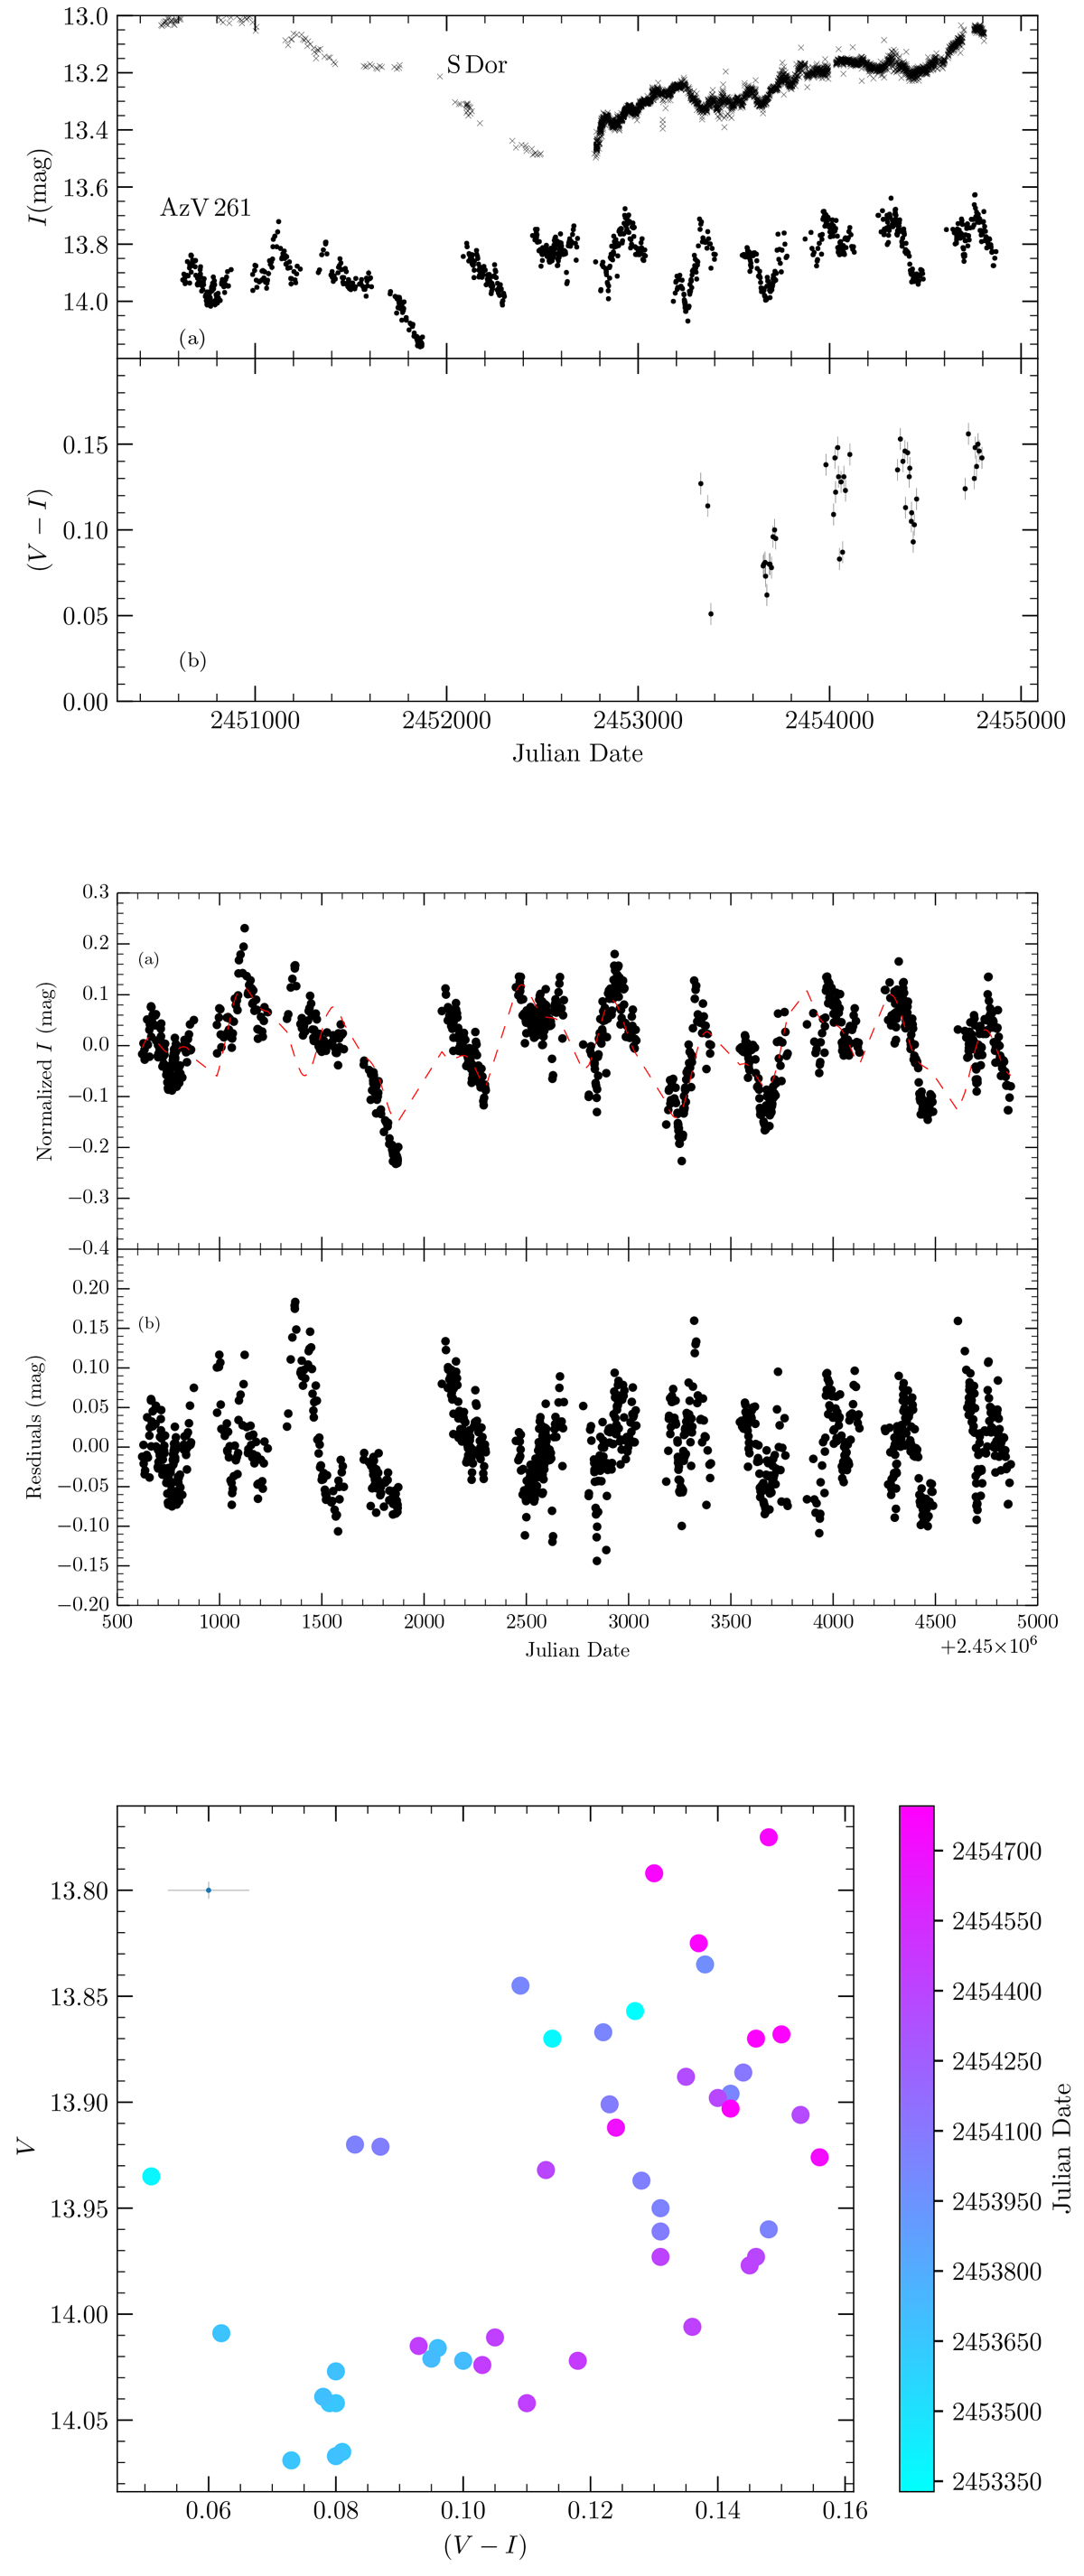
Top: I-band light curve of AzV 261 spanning from 1998 to 2009. Also shown is the scaled historical light curve of the classic LBV star S Doradus for comparison (crosses). Panel b: (V−I) colour plotted against the Julian date for AzV 261. Middle: (panel a) light curve with the overall trend removed by a fourth-degree polynomial, with the best-fit predicted light curve (the three peaks are given in Table 1). Panel b: residuals between the fit period and the observed light curve. Bottom: V vs. (V−I) colour-magnitude diagram of AzV 261 over time, with time given by the colourbar. The behaviour of a brightness increase corresponding to a temperature decrease is seen here.
Current usage metrics show cumulative count of Article Views (full-text article views including HTML views, PDF and ePub downloads, according to the available data) and Abstracts Views on Vision4Press platform.
Data correspond to usage on the plateform after 2015. The current usage metrics is available 48-96 hours after online publication and is updated daily on week days.
Initial download of the metrics may take a while.