Fig. 4.
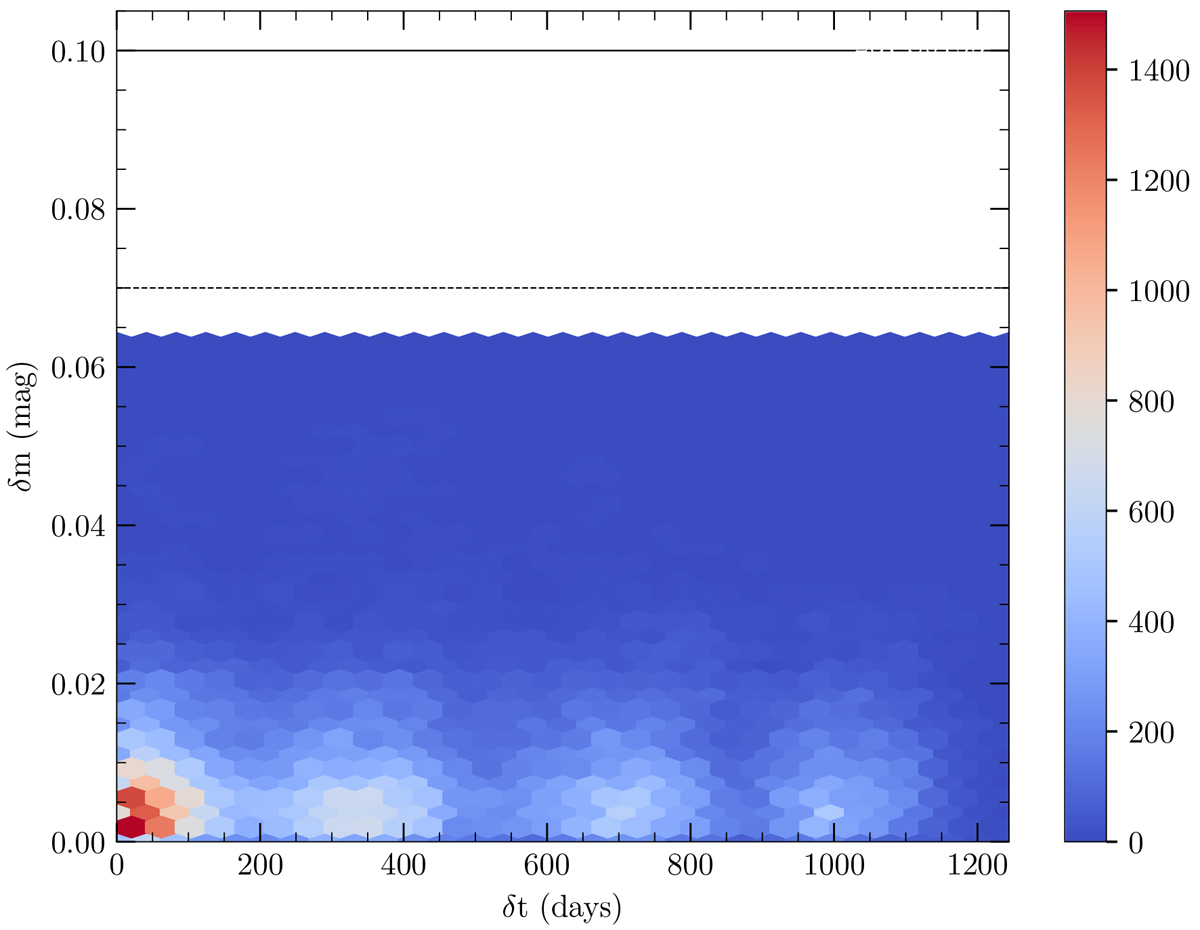
Two-dimensional histogram (δm–δt) of the Bsg 2dFS1053 from the OGLE II data, where the colour gradient marks the density of the points (see the colourbar). The dashed line marks the 10σ level of the random photometric uncertainty, while the solid line differentiates variations above the 0.1m level. The δm–δt two-dimensional histograms of the remaining Bsgs are included in Fig. C.1.
Current usage metrics show cumulative count of Article Views (full-text article views including HTML views, PDF and ePub downloads, according to the available data) and Abstracts Views on Vision4Press platform.
Data correspond to usage on the plateform after 2015. The current usage metrics is available 48-96 hours after online publication and is updated daily on week days.
Initial download of the metrics may take a while.