Fig. 3.
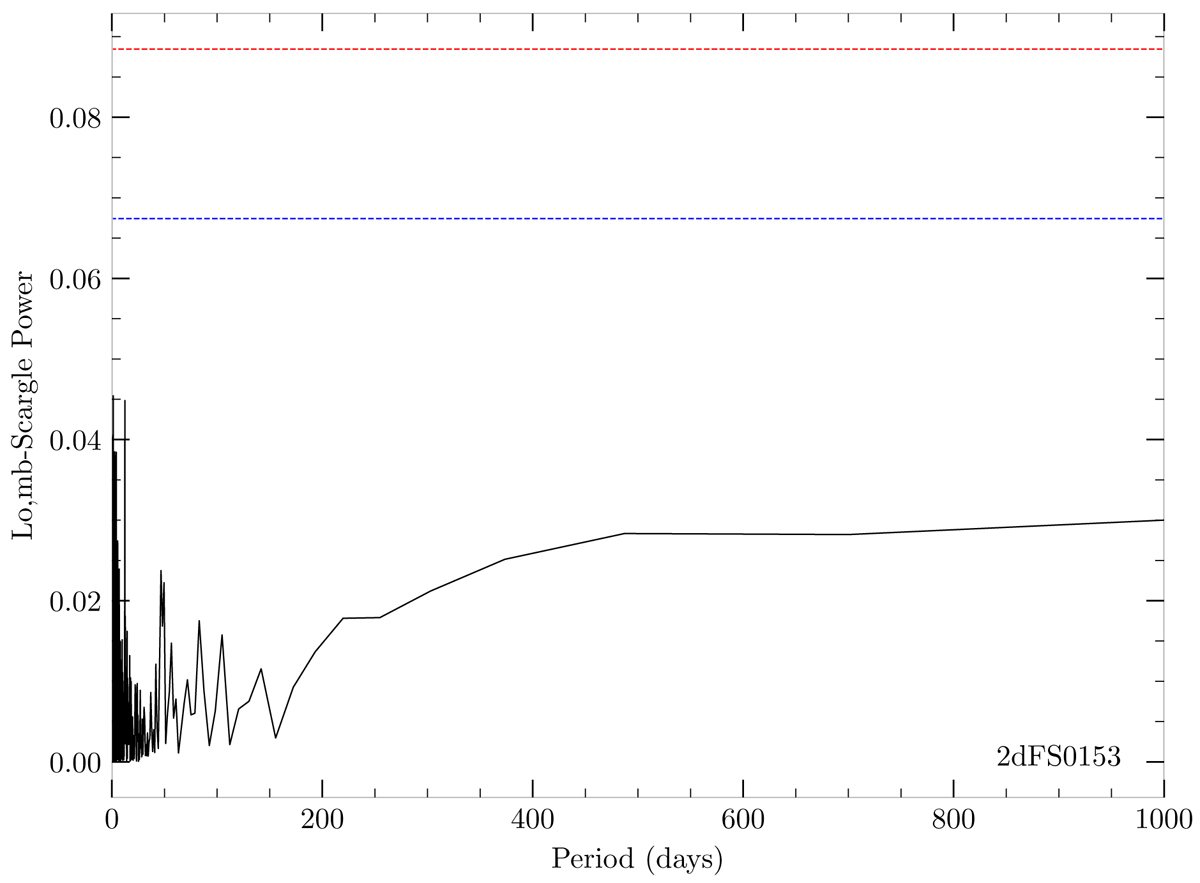
Representative Lomb–Scargle periodogram of Bsg 2dFS0153. The period in days is plotted against the Lomb–Scargle power. The dashed red and blue lines are the 99% and 95% significance levels identified using the bootstrap Monte Carlo simulations. Periodic variables are those whose peak in the power spectrum is greater than the 99% significance level. Lomb–Scargle periodograms of the remaining 63 Bsgs are displayed in Fig. B.1.
Current usage metrics show cumulative count of Article Views (full-text article views including HTML views, PDF and ePub downloads, according to the available data) and Abstracts Views on Vision4Press platform.
Data correspond to usage on the plateform after 2015. The current usage metrics is available 48-96 hours after online publication and is updated daily on week days.
Initial download of the metrics may take a while.