Fig. 13.
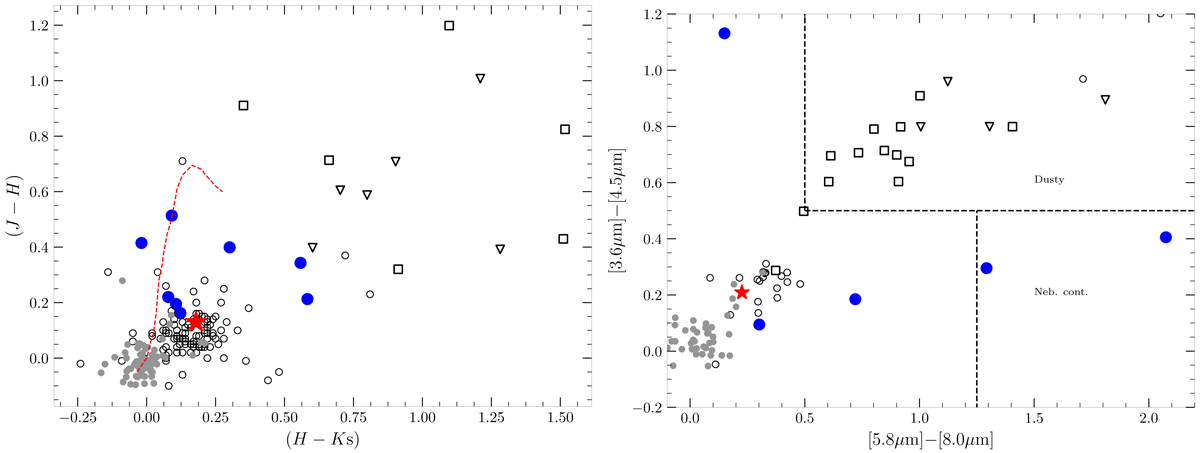
Left: near-infrared (J−H) vs. (H−K s) colour–colour diagram of known sgB[e] (open squares), warm hypergiants (open triangles), cBe stars (open circles), known S Doradus variables (blue dots), BSgs (small dots), and AzV 261 (red asterisk). Data taken from Humphreys et al. (2017a). The dashed red line is the main sequence locus at SMC metallicity. Right: mid-infrared [3.6 μm]–[4.5 μm] vs. [5.8 μm]–[8.0 μm] colour–colour diagram. Symbols are as in the left panel. The position of AzV 261 in both diagrams suggests the presence of free–free emission. The LBVs redward of colours [5.8 μm]–[8.0 μm] > 1.0 are contaminated by polycyclic aromatic hydrocarbon emission from nebulosity, with the regions of nebular contamination and dusty stars indicated following Humphreys et al. (2017a).
Current usage metrics show cumulative count of Article Views (full-text article views including HTML views, PDF and ePub downloads, according to the available data) and Abstracts Views on Vision4Press platform.
Data correspond to usage on the plateform after 2015. The current usage metrics is available 48-96 hours after online publication and is updated daily on week days.
Initial download of the metrics may take a while.