Fig. 12.
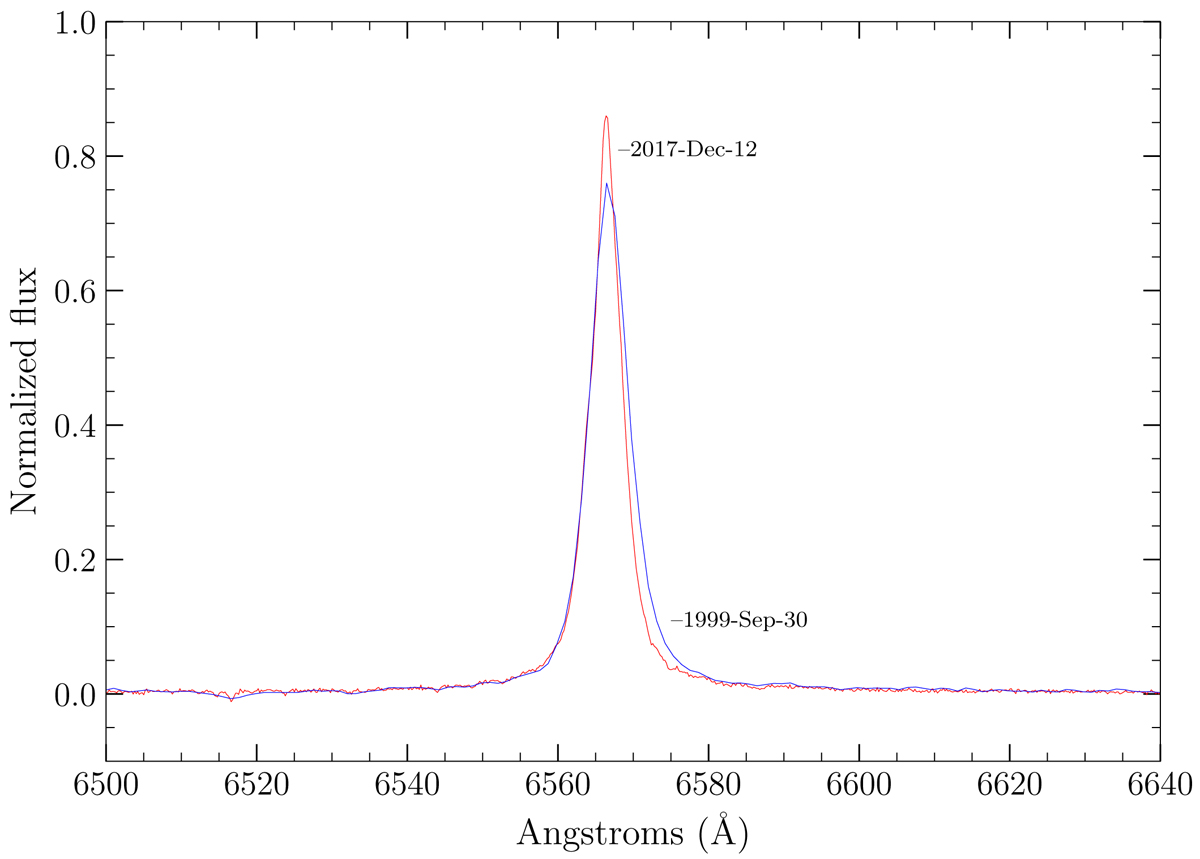
Normalized Hα line profile from the X shooter spectra taken in 2017 December (red) and archival spectra from Evans et al. (2004) taken in 1999 September shown as solid blue lines. The emission line equivalent width increased by −16.1 Å within this period. We note that if the sky subtraction from the Evans et al. (2004) fibre spectra is poor, this difference will only be magnified.
Current usage metrics show cumulative count of Article Views (full-text article views including HTML views, PDF and ePub downloads, according to the available data) and Abstracts Views on Vision4Press platform.
Data correspond to usage on the plateform after 2015. The current usage metrics is available 48-96 hours after online publication and is updated daily on week days.
Initial download of the metrics may take a while.