Fig. A.1.
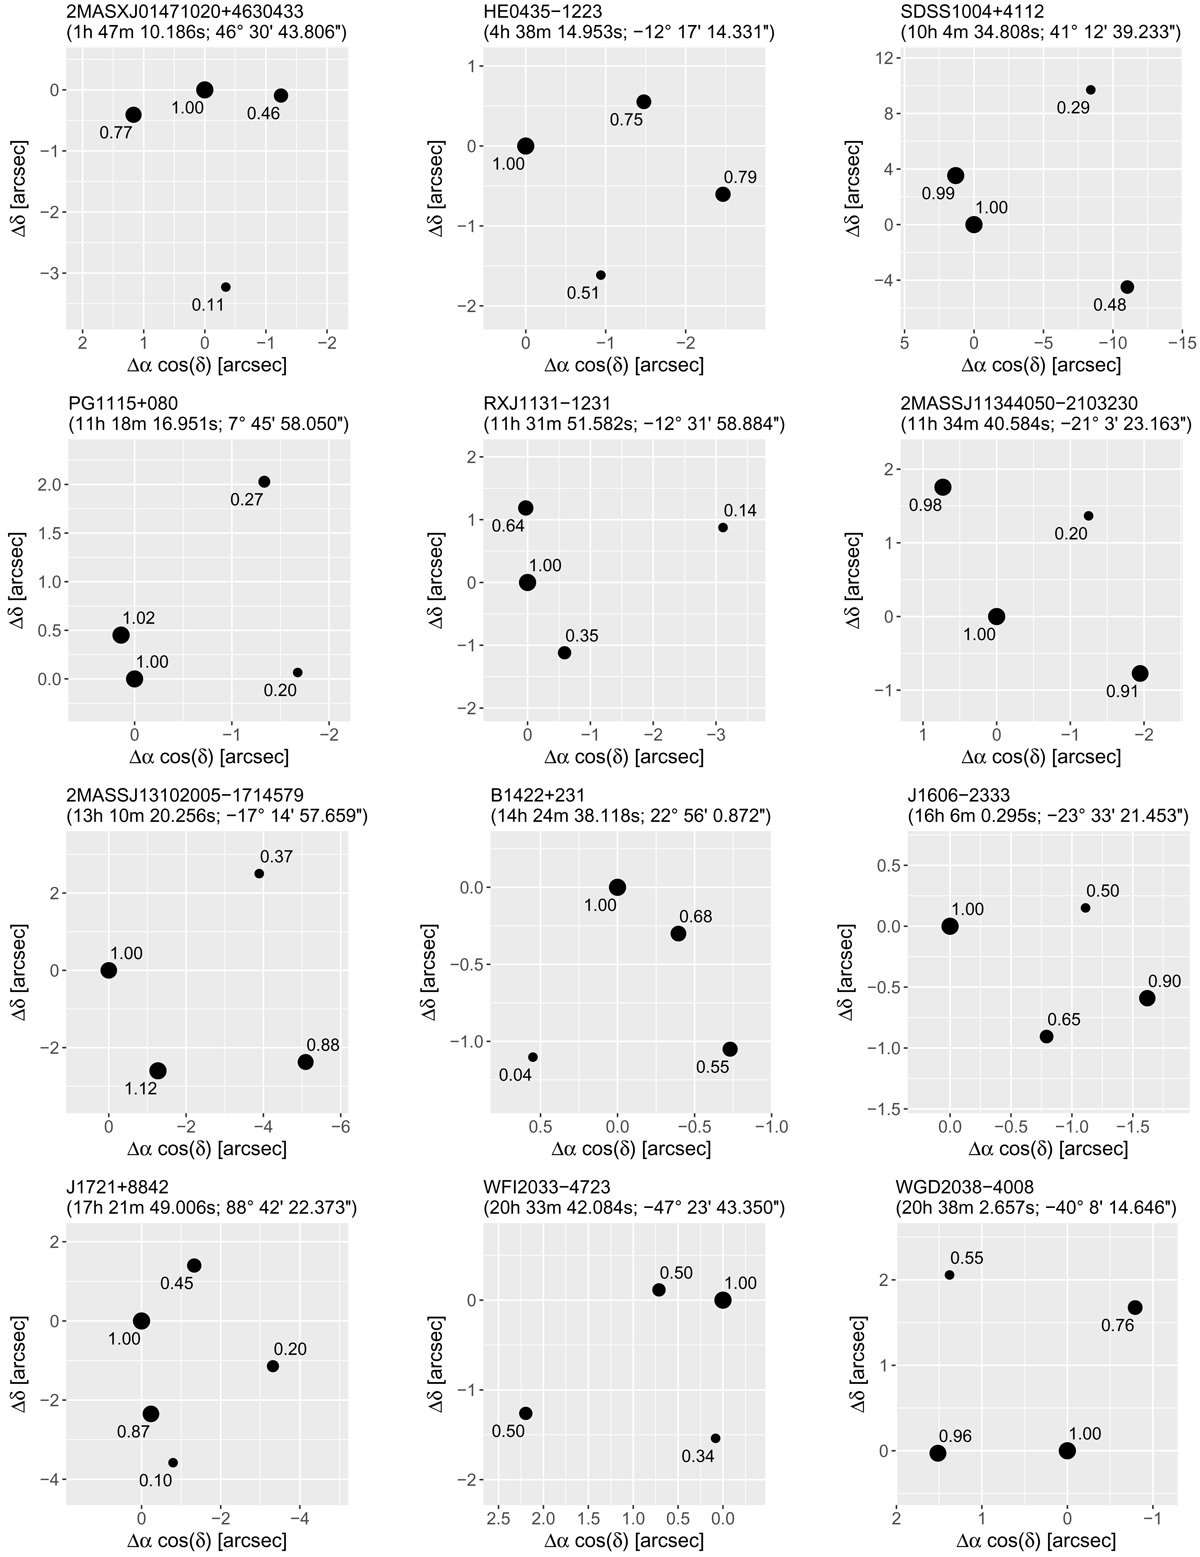
Finding charts for the known GLs with four counterparts in the Gaia DR2. Gaia DR2 astrometry relative to the brightest image (A image) based on the original system discovery data is indicated by black points (except WGD2038-4008, see footnote in Table B.1). The numbers near each image, and the image size, indicate the flux ratios to the brightest image in the original system discovery data. We note that in some cases this may not be the brightest image detected by Gaia and therefore generates some flux ratios >1. North is up, east is left.
Current usage metrics show cumulative count of Article Views (full-text article views including HTML views, PDF and ePub downloads, according to the available data) and Abstracts Views on Vision4Press platform.
Data correspond to usage on the plateform after 2015. The current usage metrics is available 48-96 hours after online publication and is updated daily on week days.
Initial download of the metrics may take a while.