Fig. 3.
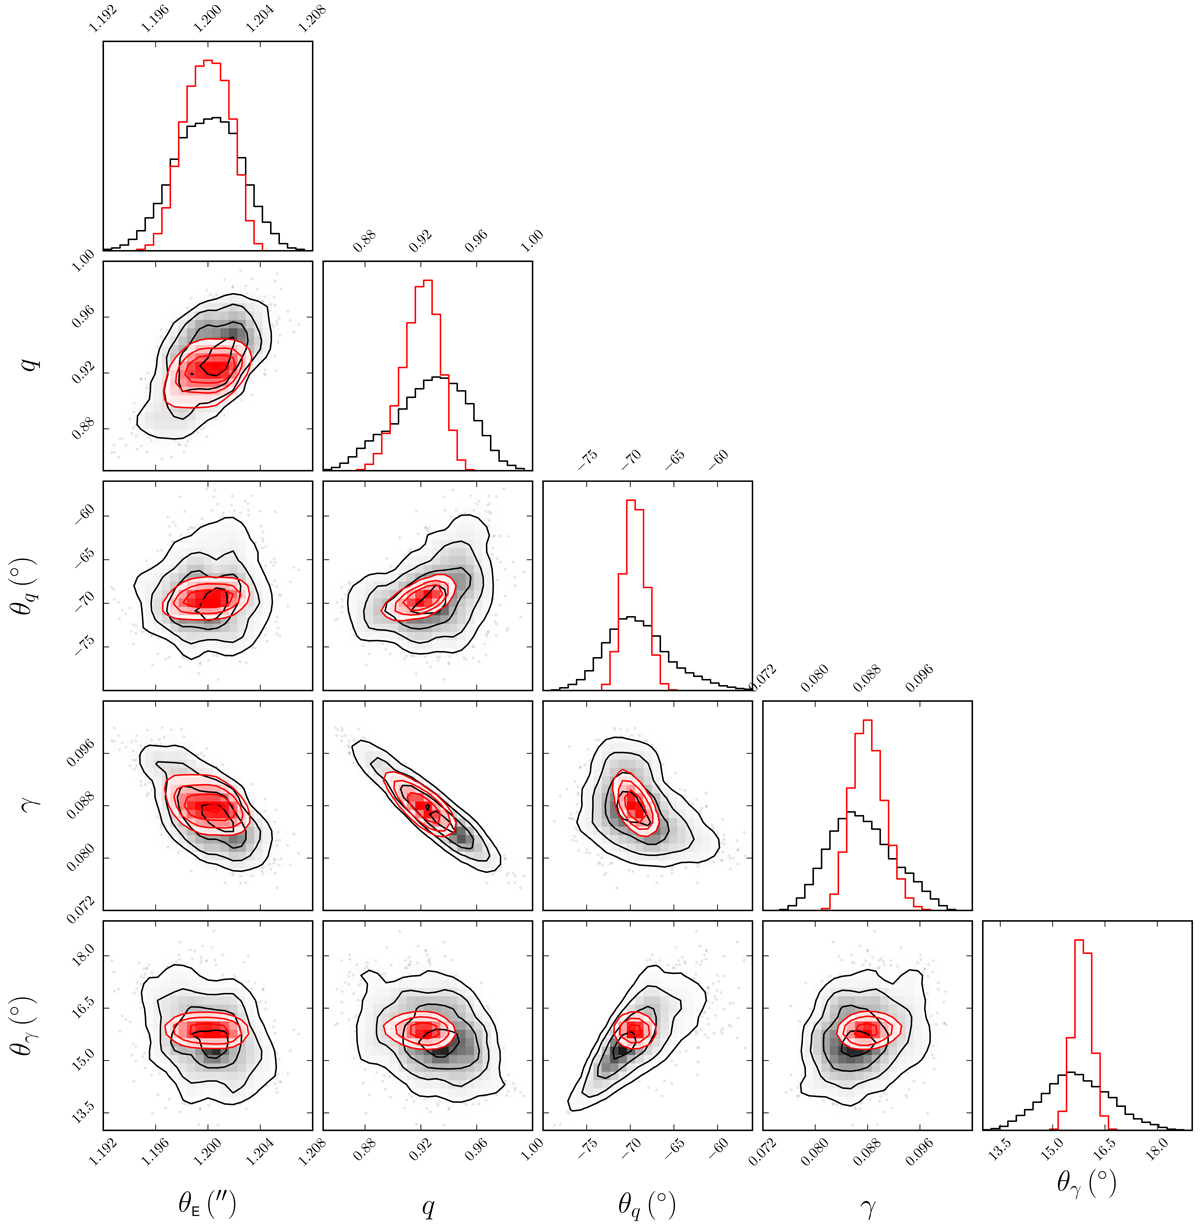
Results of the MCMC simulations for HE0435-1223, displayed as a corner plot for the five model parameters. Results obtained from Gaia’s data are presented in red and with HST data in grey. The diagonal panels illustrate the posterior PDFs while the off-axis panels illustrate the correlation between the parameters. The three inner contours represent the 68.3%, 95.4%, and 99.7% confidence intervals.
Current usage metrics show cumulative count of Article Views (full-text article views including HTML views, PDF and ePub downloads, according to the available data) and Abstracts Views on Vision4Press platform.
Data correspond to usage on the plateform after 2015. The current usage metrics is available 48-96 hours after online publication and is updated daily on week days.
Initial download of the metrics may take a while.