Free Access
Fig. 9.
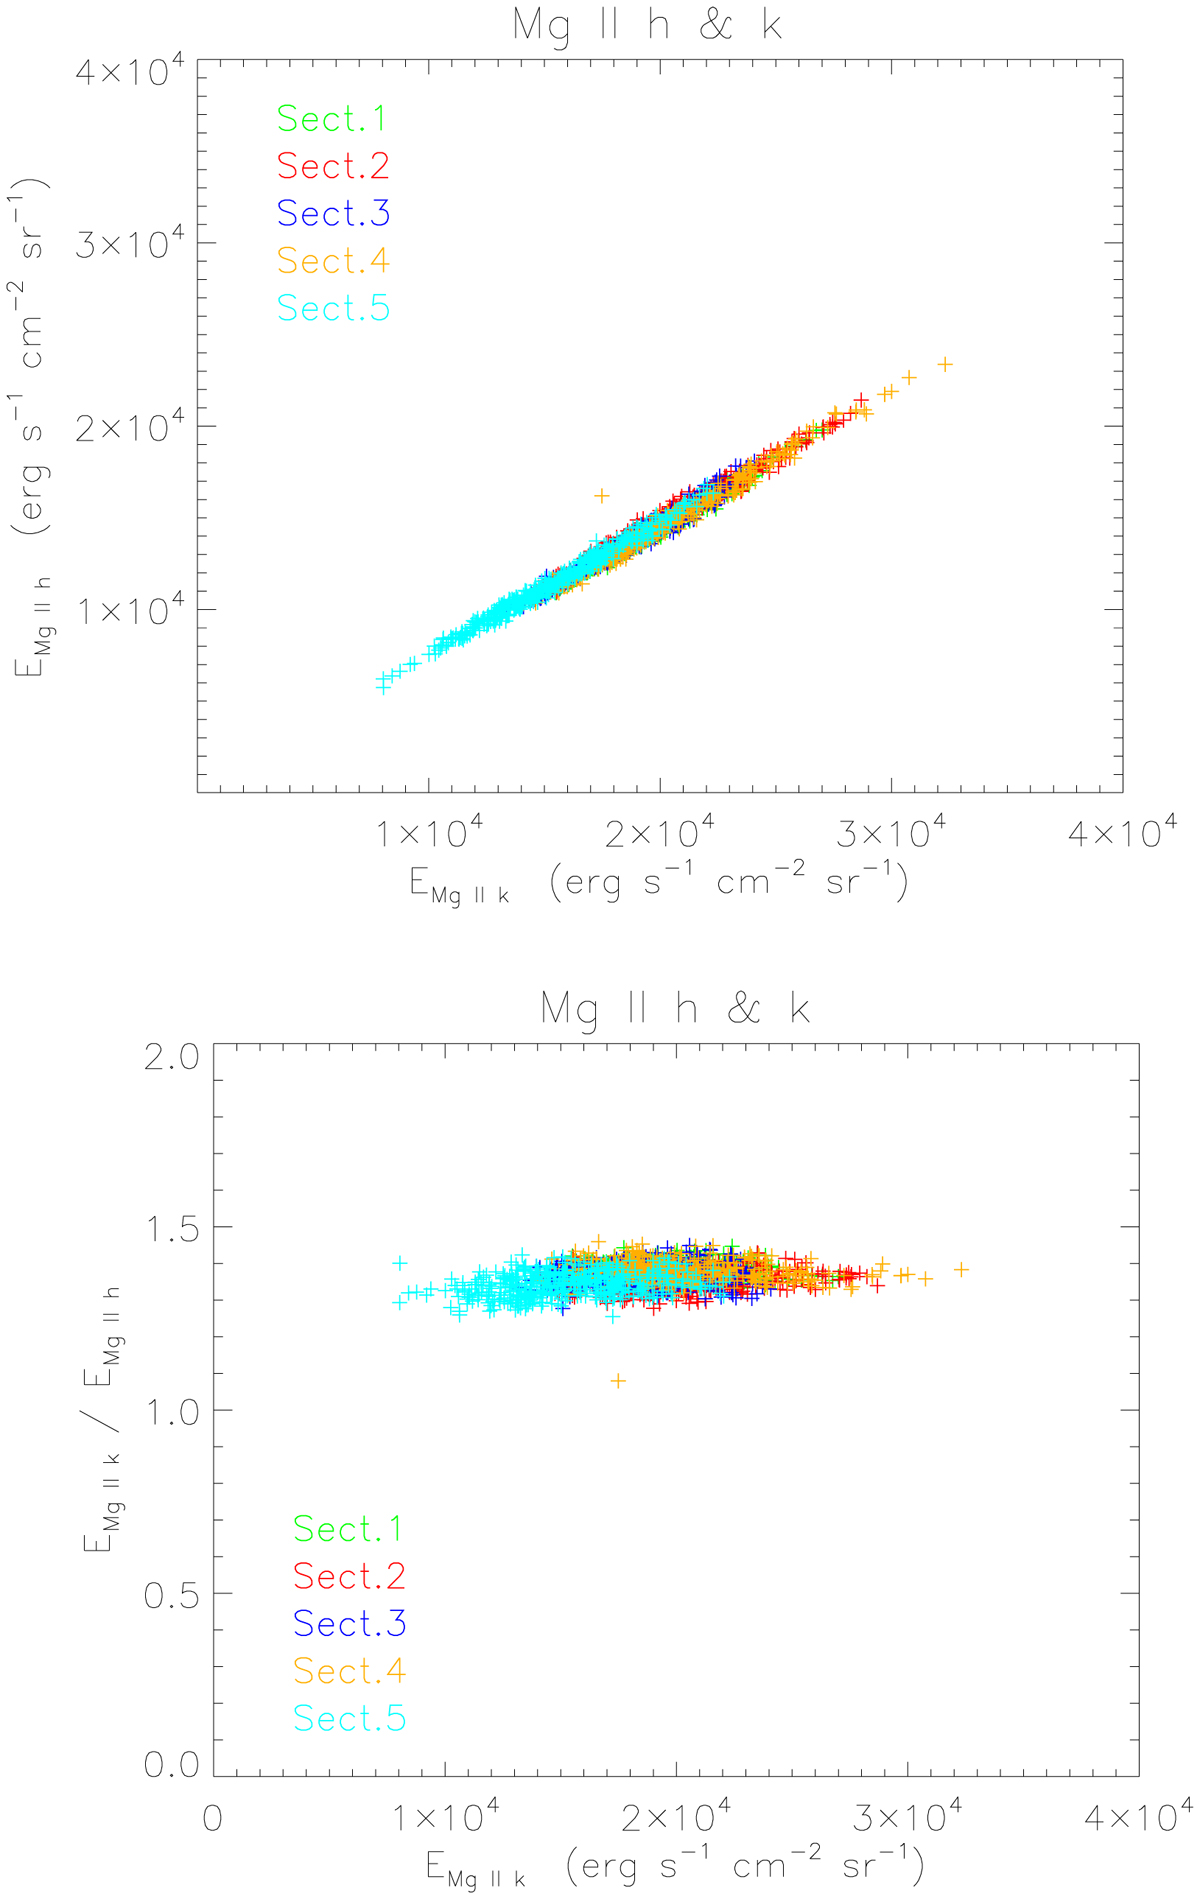
Comparison between integrated intensity emitted in the Mg II h line~and integrated intensity emitted in the Mg II k line for five selected sections (upper panel) and ratio of integrated intensities between Mg II k and Mg II h lines as function of integrated intensity emitted in Mg II k line (lower panel).
Current usage metrics show cumulative count of Article Views (full-text article views including HTML views, PDF and ePub downloads, according to the available data) and Abstracts Views on Vision4Press platform.
Data correspond to usage on the plateform after 2015. The current usage metrics is available 48-96 hours after online publication and is updated daily on week days.
Initial download of the metrics may take a while.