Free Access
Fig. 8.
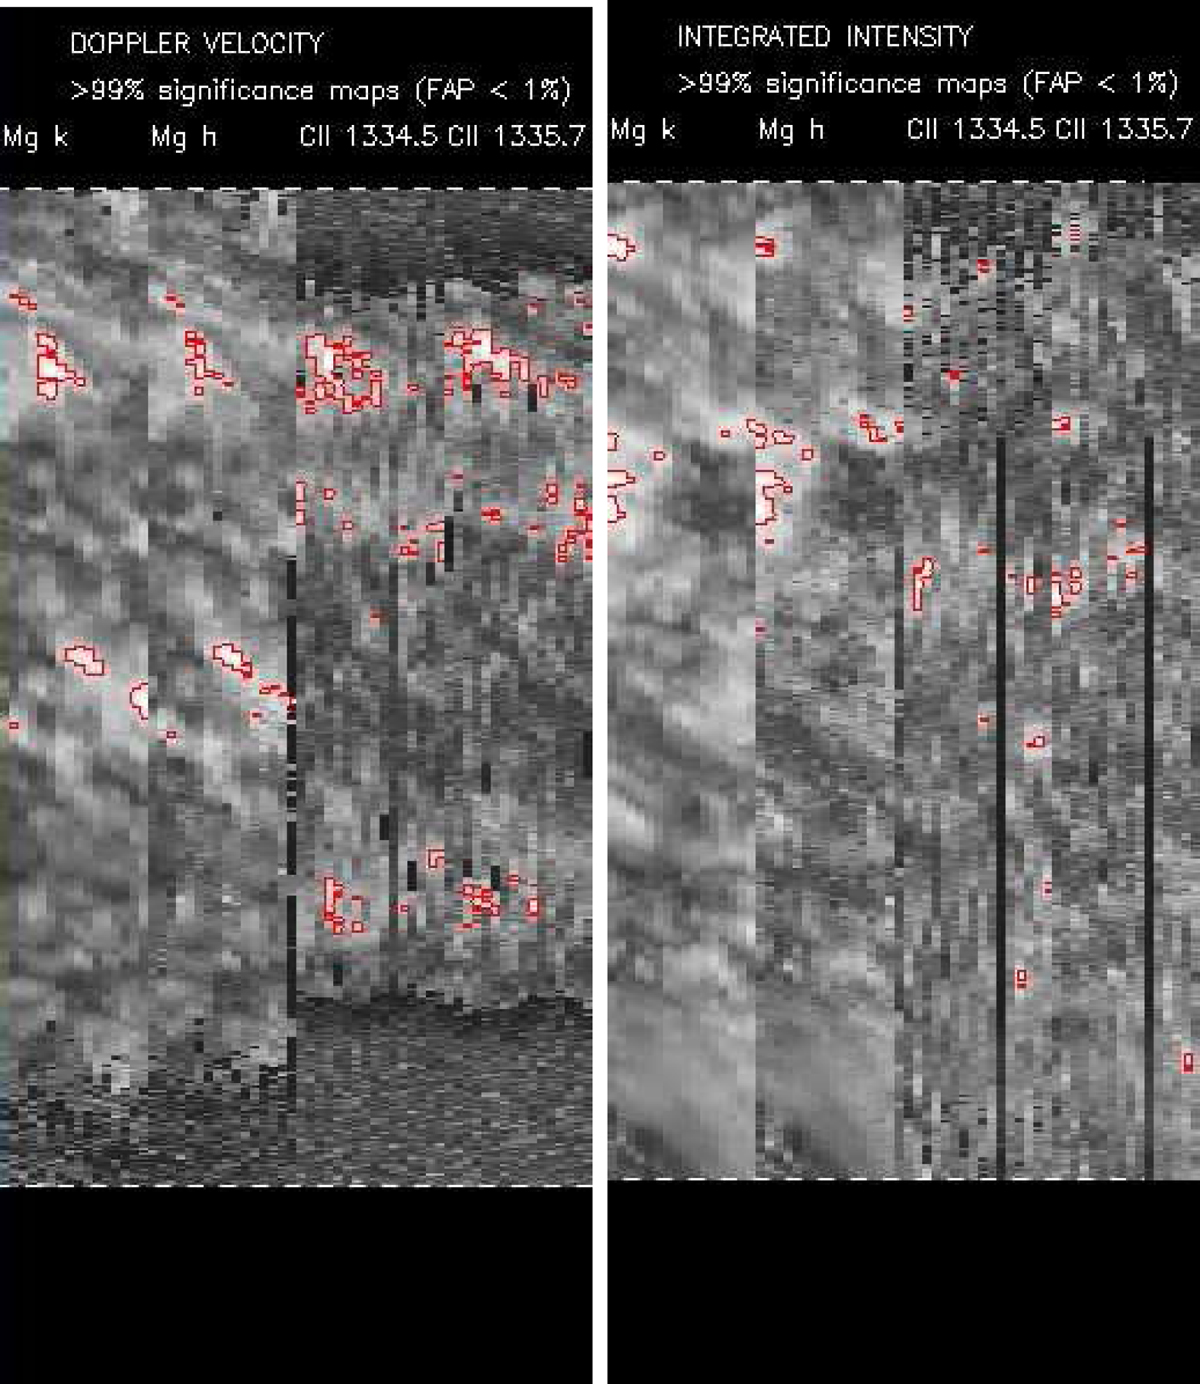
Spectral power of the Doppler signal (left panel) and maximum intensity signal (right panel). Each rectangle corresponds to the spectral line indicated above. Red curves limit areas with FAP < 1%.
Current usage metrics show cumulative count of Article Views (full-text article views including HTML views, PDF and ePub downloads, according to the available data) and Abstracts Views on Vision4Press platform.
Data correspond to usage on the plateform after 2015. The current usage metrics is available 48-96 hours after online publication and is updated daily on week days.
Initial download of the metrics may take a while.