Fig. 18.
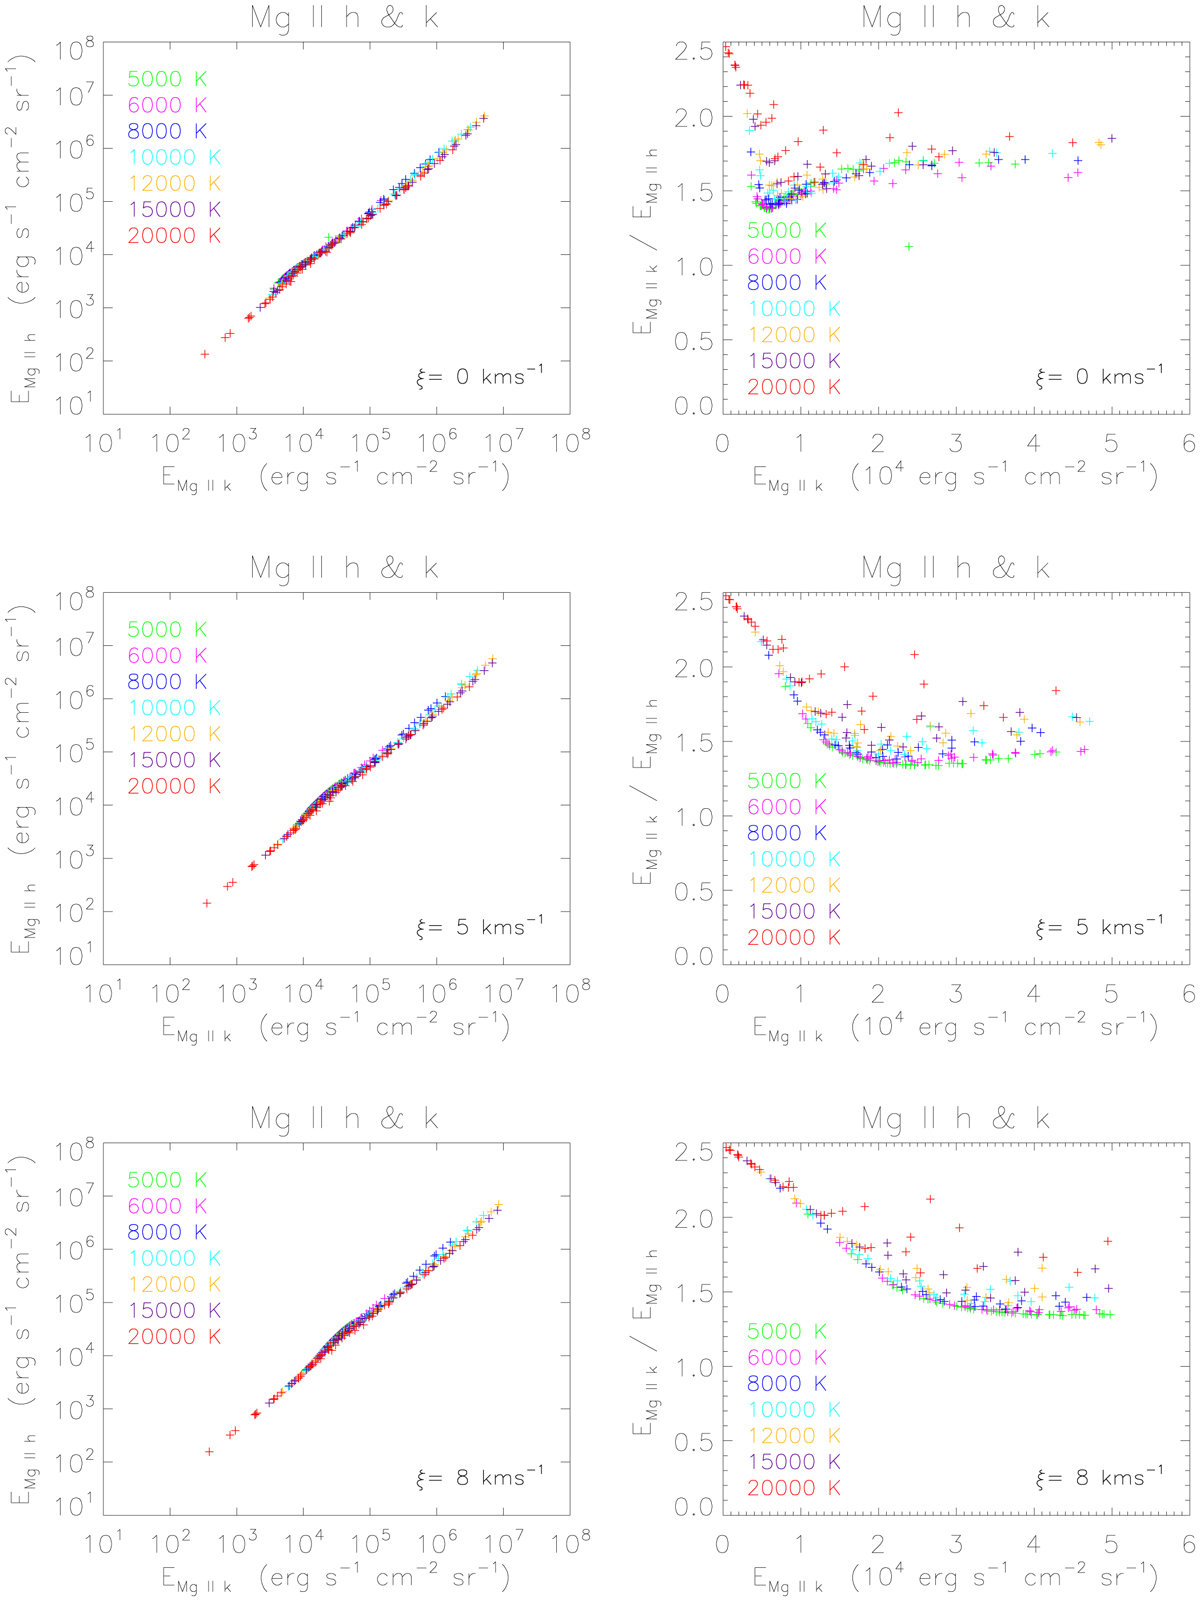
Integrated intensity emitted in Mg II h line versus Mg II k line for all 343 model points at different temperatures (left panels). Right panels: ratio of integrated intensity of the Mg II k line to the Mg II h line versus the integrated intensity of the Mg II k line for different temperatures at three representative microturbulent velocities.
Current usage metrics show cumulative count of Article Views (full-text article views including HTML views, PDF and ePub downloads, according to the available data) and Abstracts Views on Vision4Press platform.
Data correspond to usage on the plateform after 2015. The current usage metrics is available 48-96 hours after online publication and is updated daily on week days.
Initial download of the metrics may take a while.