Fig. 9.
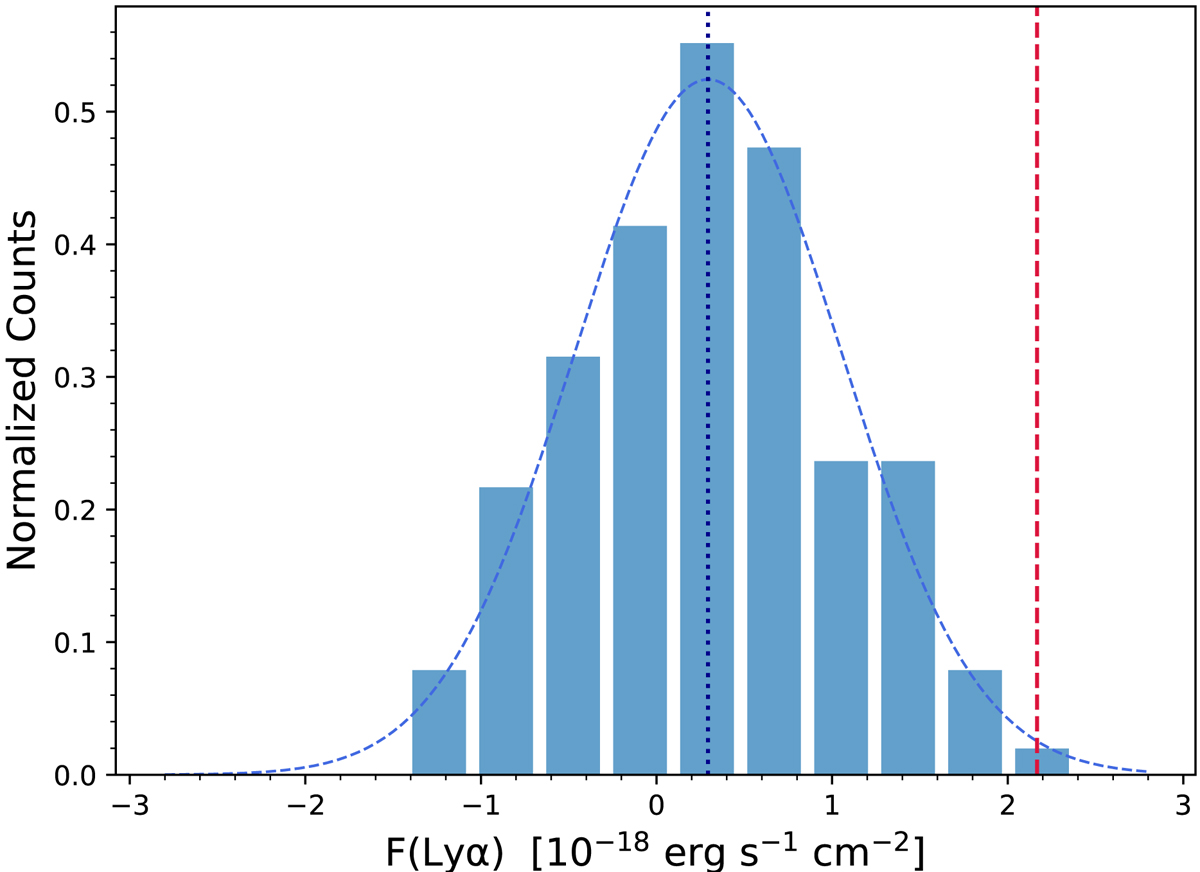
Histogram shows the distribution of fluxes measured in apertures randomly located around the detected emission. The apertures have the same size as that used for the Lyα measurement. The mean of the distribution (vertical dotted line) provides an estimate of the zero flux level and the dispersion provides a more conservative estimate of the noise in the aperture. The red dashed vertical line shows the measured value of Lyα emission associated with the DLA.
Current usage metrics show cumulative count of Article Views (full-text article views including HTML views, PDF and ePub downloads, according to the available data) and Abstracts Views on Vision4Press platform.
Data correspond to usage on the plateform after 2015. The current usage metrics is available 48-96 hours after online publication and is updated daily on week days.
Initial download of the metrics may take a while.