Fig. 5.
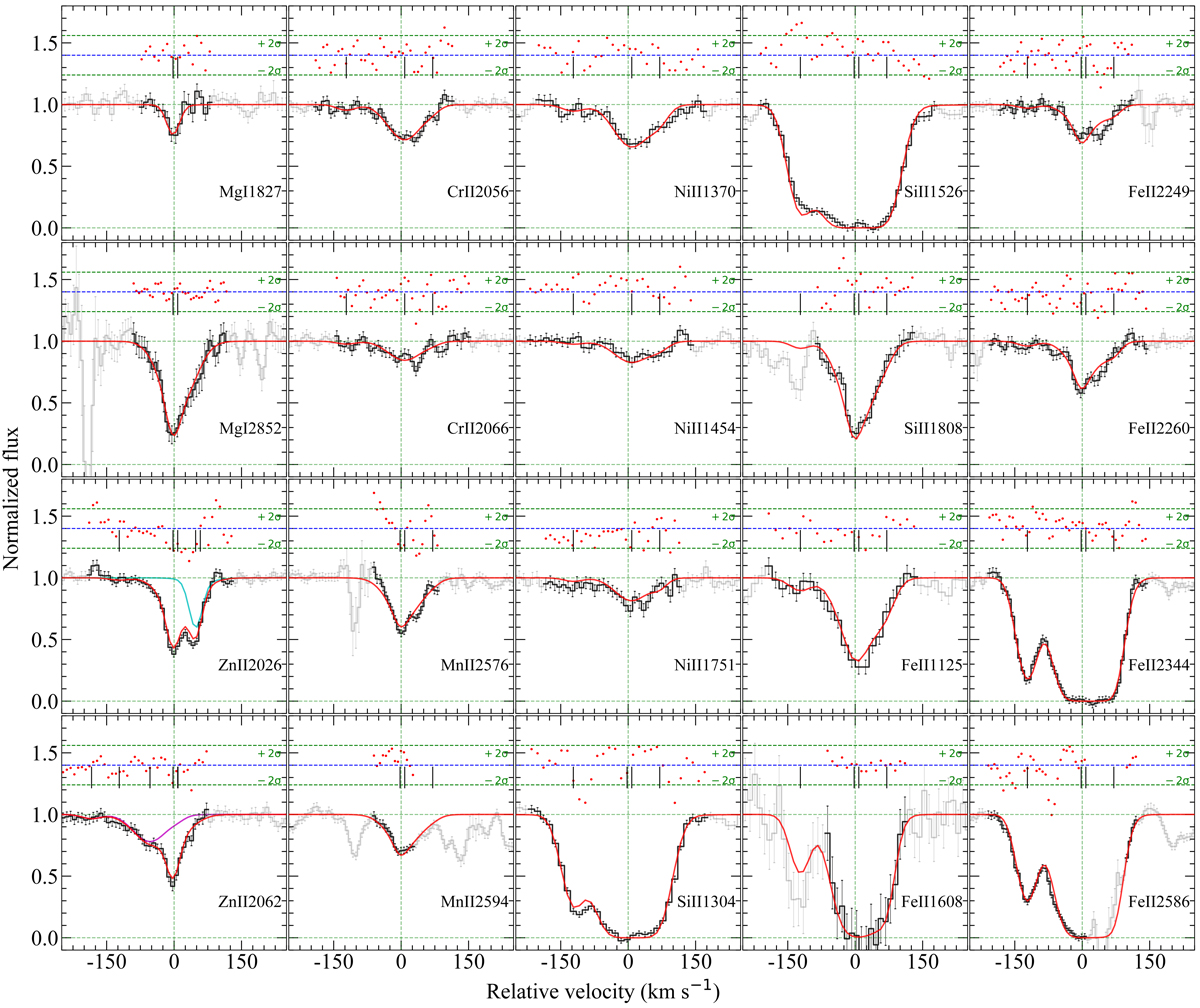
Absorption profiles of Si II, Ni II, Fe II, Zn II, Cr II, Mn II, and Mg I. The grey line represents the data with parts used to constrain the fit shown in black. The red line represents the synthetic profile. The black tick marks on top of the profile show the position of individual velocity components. The top box represents the residuals in the ±2σ range. The individual contributions from Mg I and Cr II in the box showing Zn II(λ = 2026 and 2062) profiles are shown in cyan and magenta respectively.
Current usage metrics show cumulative count of Article Views (full-text article views including HTML views, PDF and ePub downloads, according to the available data) and Abstracts Views on Vision4Press platform.
Data correspond to usage on the plateform after 2015. The current usage metrics is available 48-96 hours after online publication and is updated daily on week days.
Initial download of the metrics may take a while.