Fig. 3.
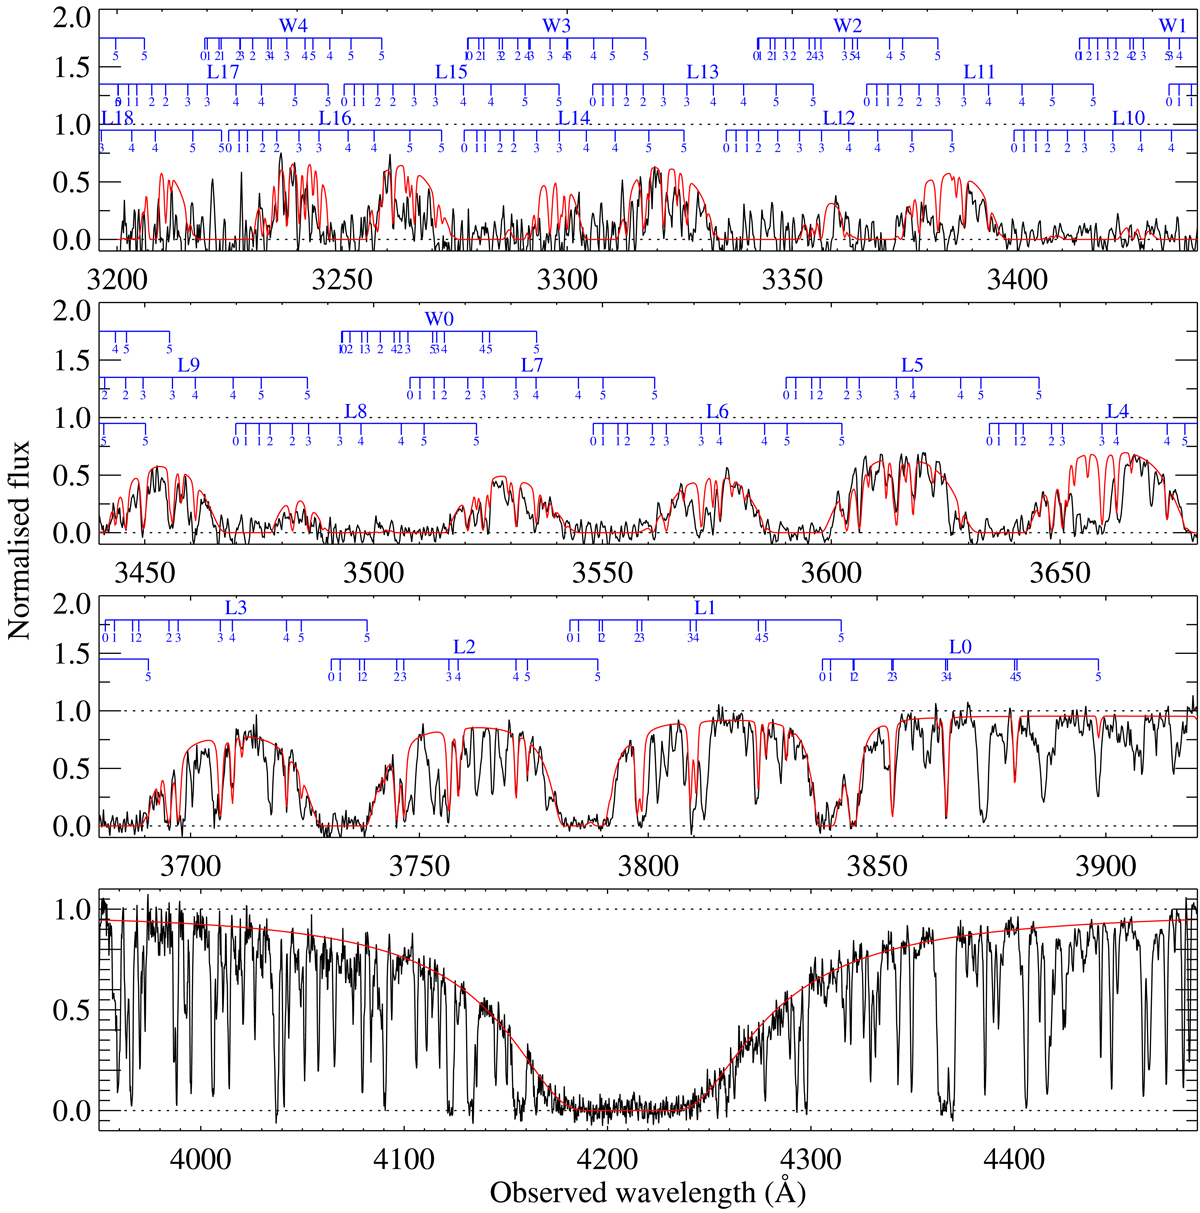
Portion of the X-shooter spectrum of J 1513+0352 covering the absorption lines of H I (Lyman-α shown in the bottom panel) and H2 (top three panels) from the DLA at z = 2.4636. The normalised data are shown in black and the synthetic profile is overplotted in red. We note the very strong flux suppression at the bluest wavelengths due to the increased overlapping of H2 lines. Horizontal blue segments connect rotational levels (short tick marks) from a given Lyman (L) or Werner (W) band, as labelled above.
Current usage metrics show cumulative count of Article Views (full-text article views including HTML views, PDF and ePub downloads, according to the available data) and Abstracts Views on Vision4Press platform.
Data correspond to usage on the plateform after 2015. The current usage metrics is available 48-96 hours after online publication and is updated daily on week days.
Initial download of the metrics may take a while.