Fig. 13.
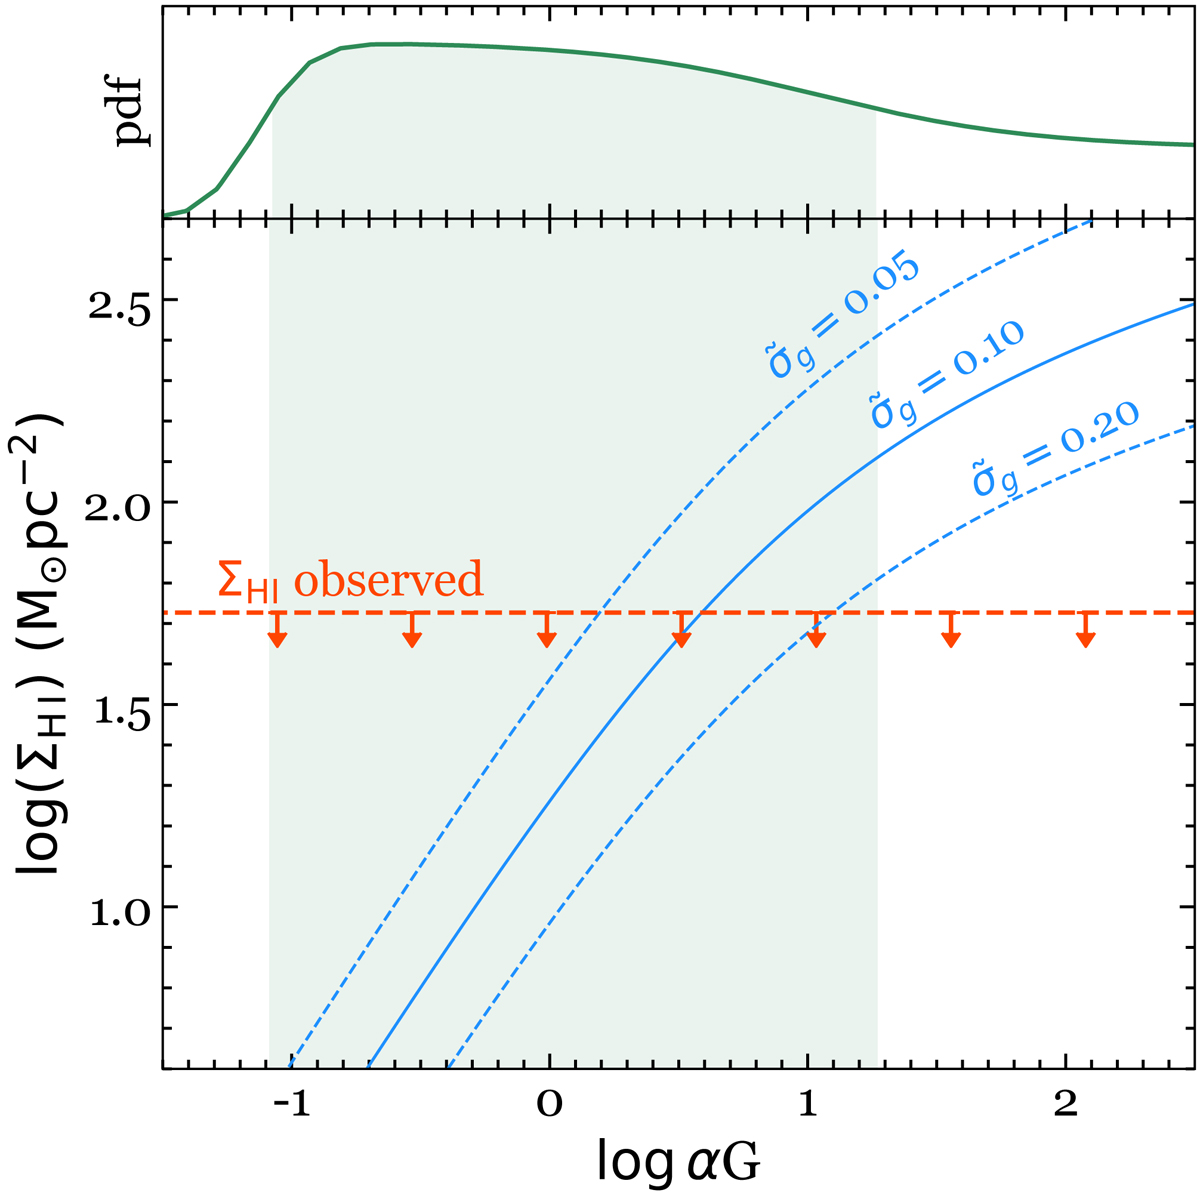
Comparison of H I–H2 transition theory predictions with observations. Top panel: derived probability distribution function of αG from excitation of C I fine-structure levels. The green shaded region shows the interval estimate on αG corresponding to 0.683 confidence level. Bottom panel: theoretical H I surface density of a single H I–H2 transition layer as a function of αG Eq. (5) for ![]() shown by a solid blue line. The two dashed blue lines correspond to the derived range for
shown by a solid blue line. The two dashed blue lines correspond to the derived range for ![]() . The observed total H I column density is shown as a red horizontal line with downwards arrows, since part of the H I is likely not to be associated with the molecular cloud.
. The observed total H I column density is shown as a red horizontal line with downwards arrows, since part of the H I is likely not to be associated with the molecular cloud.
Current usage metrics show cumulative count of Article Views (full-text article views including HTML views, PDF and ePub downloads, according to the available data) and Abstracts Views on Vision4Press platform.
Data correspond to usage on the plateform after 2015. The current usage metrics is available 48-96 hours after online publication and is updated daily on week days.
Initial download of the metrics may take a while.