Fig. 11.
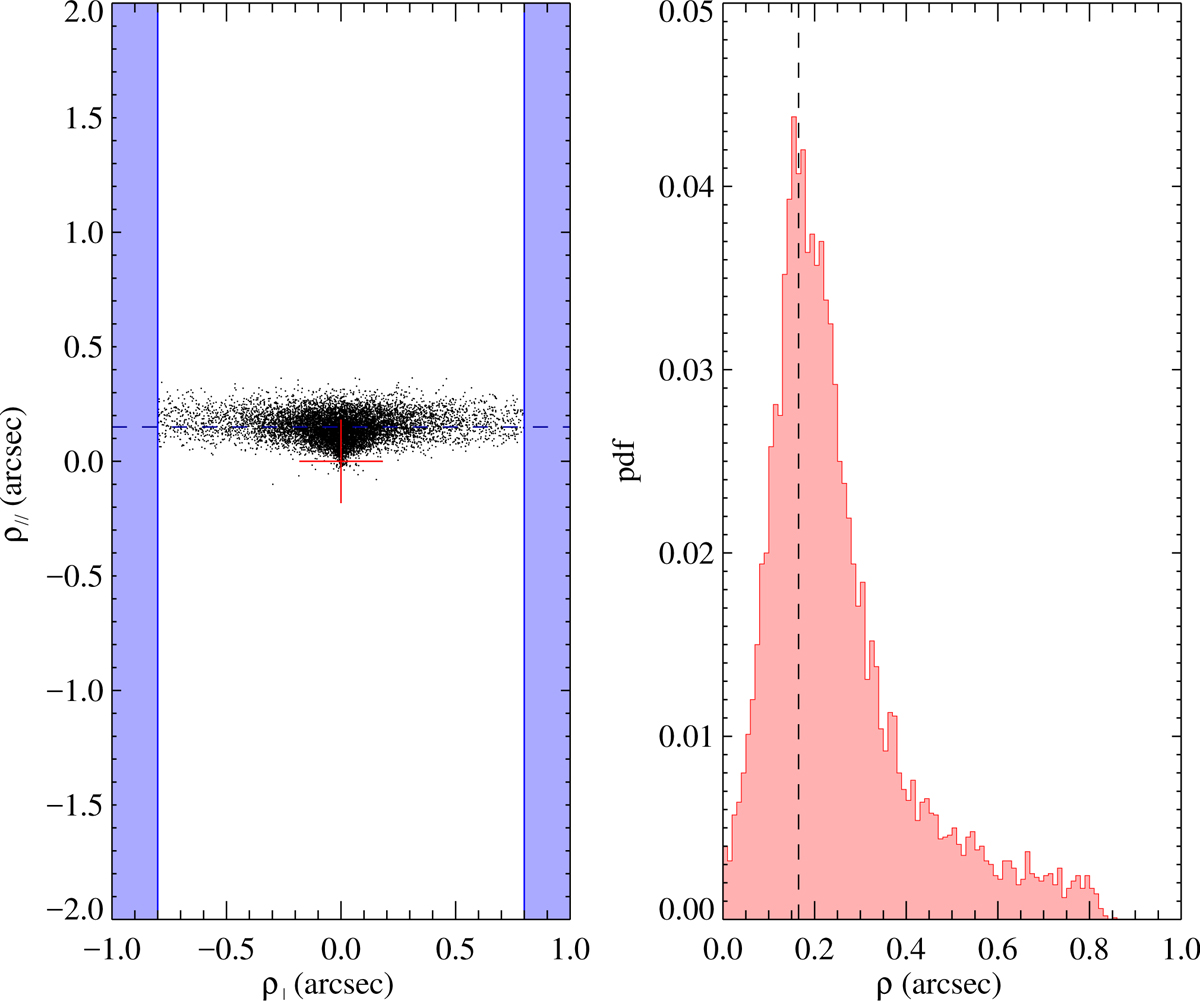
Left: layout of the 1.6″-wide slit (white region) with the position of the quasar marked as red cross. The dashed line represents our measured constraint on ρ‖. The value ρ⊥ is constrained to be within the slit width. The black points show the distribution of possible locations of the emission, taking into account a normally distributed uncertainty on ρ‖ and a uniformly distributed random angle between quasar-galaxy and slit directions. Right: probability distribution function of the impact parameter.
Current usage metrics show cumulative count of Article Views (full-text article views including HTML views, PDF and ePub downloads, according to the available data) and Abstracts Views on Vision4Press platform.
Data correspond to usage on the plateform after 2015. The current usage metrics is available 48-96 hours after online publication and is updated daily on week days.
Initial download of the metrics may take a while.