Fig. 10.
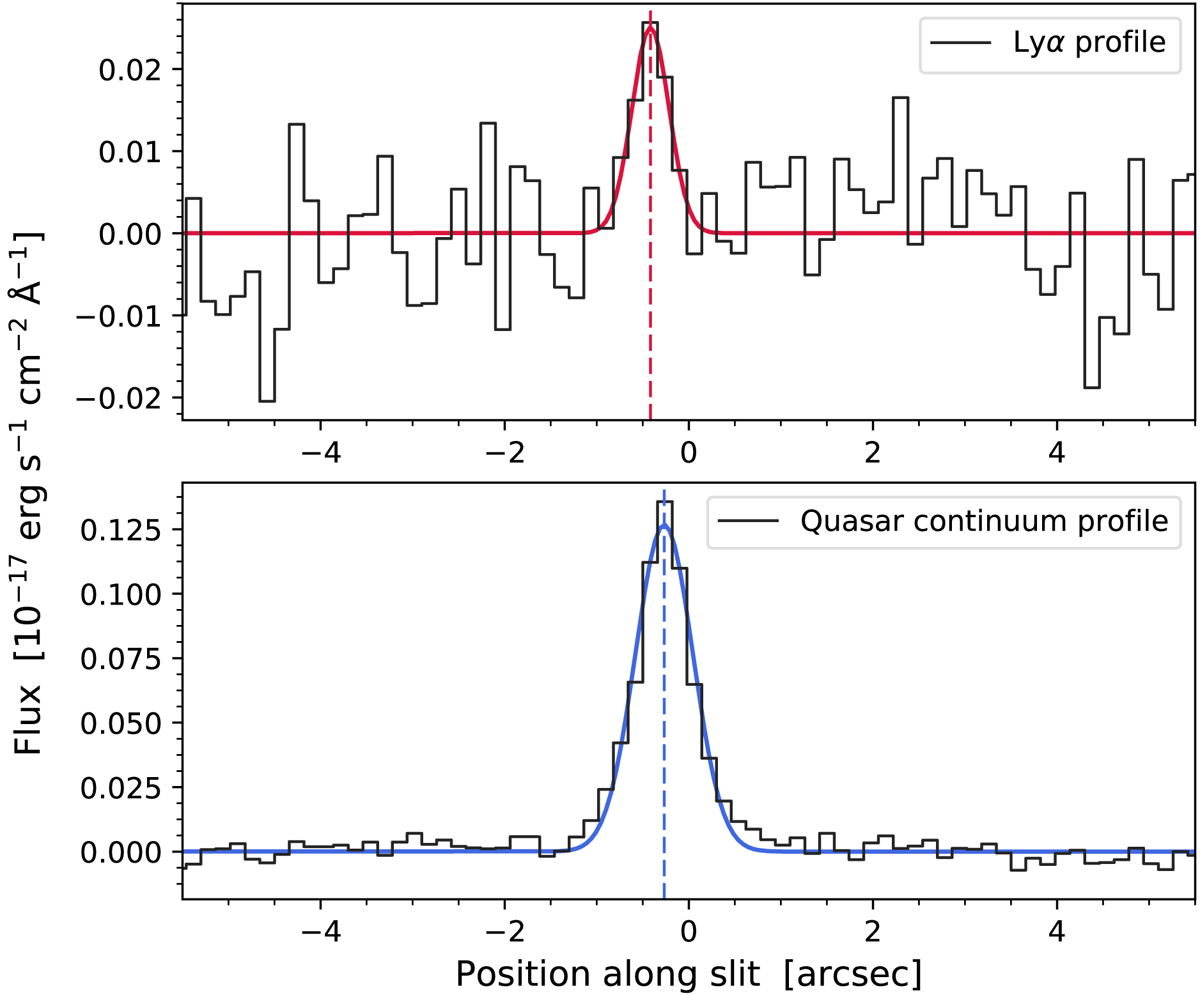
Spatial profile of the Lyα emission (top) and quasar continuum (bottom) along the slit. The Lyα profile has been averaged over 10 pixels centred at the Lyα position (4211.8 Å). The quasar continuum profile has been averaged over the wavelength range free of strong absorption (4135−4150 Å). In each panel, we show the best-fit Gaussian model to the data. The vertical dashed lines indicate the centres of the profiles.
Current usage metrics show cumulative count of Article Views (full-text article views including HTML views, PDF and ePub downloads, according to the available data) and Abstracts Views on Vision4Press platform.
Data correspond to usage on the plateform after 2015. The current usage metrics is available 48-96 hours after online publication and is updated daily on week days.
Initial download of the metrics may take a while.